Structure
I’m setting this up on a Kubernetes Cluster using the OpenTelemetry Operator, but since the Collector CRD is basically just a config file anyways, this can be replicated with regular deployments too. The graph below shows how traces are processed by the OTel Collector, the Span Metrics Connector and Service Graph Connector are used in the pipeline to generate metrics.
flowchart TD
    subgraph Monitoring Namespace
    prom(Prometheus)
    tempo(Tempo)
    end

    subgraph Application Namespace
        app(Applications) --> otelc
        subgraph otelc [OpenTelemetry Collector]
        tr(Trace Reciever)
        tr --> te(Trace Exporter)
        tr --> smc(Span Metric Connector)
        tr --> sgc(Service Graph Connector)
        smc --> me(Metric Exporter)
        sgc --> me
        end
    end

    te --> tempo
    me <-->|ServiceMonitor| prom
Configuration
OTel Collector
The comments in the yaml below should outline everything relevant. I’ve tried my best to make it as minimal as possible.
apiVersion: opentelemetry.io/v1beta1
kind: OpenTelemetryCollector
metadata:
  name: otel
spec:
  # make sure to use a contrib image, since the main one doesn't have the connectors
  image: ghcr.io/open-telemetry/opentelemetry-collector-releases/opentelemetry-collector-contrib:0.100.0
  # add a port to the service for the metric exporter
  ports:
    - name: http-metrics
      port: 8889
  config:
    # basic recievers for incoming spans
    receivers:
      otlp:
        protocols:
          grpc: {}
          http: {}

    # connectors to generate metrics from the incoming spans
    connectors:
      # basic service graph
      servicegraph:
        latency_histogram_buckets: [100ms, 250ms, 1s, 5s, 10s]
      # a bit more elaborate spanmetrics
      spanmetrics:
        # this is relevant, since grafana expects the traces_spanmetrics_ prefix
        namespace: traces.spanmetrics
        # this is relevant, since grafana expects the historgram metrics in seconds
        histogram:
          unit: "s"
        # the rest is close to default with some minor QoL additions
        dimensions:
          - name: http.method
            default: GET
          - name: http.status_code
        exemplars:
          enabled: true
        events:
          enabled: true
          dimensions:
            - name: exception.type
            - name: exception.message
        resource_metrics_key_attributes:
          - service.name
          - telemetry.sdk.language
          - telemetry.sdk.name

    exporters:
      # trace exporter
      otlp:
        endpoint: tempo-ingester.monitoring.svc:4317
      # metric exporter
      prometheus:
        endpoint: "0.0.0.0:8889"

    processors:
      batch: {}

    service:
      pipelines:
        # send traces off to the trace reciever
        traces:
          receivers: [otlp]
          exporters: [otlp, spanmetrics, servicegraph]
          processors: [batch]
        # expose spanmetrics & service graph on the monitoring port
        metrics:
          receivers: [spanmetrics, servicegraph]
          exporters: [prometheus]
          processors: [batch]
A quick kubectl port-forward svc/otel-collector-headless 8889 and call to http://localhost:8889/metrics should already display traces_spanmetrics_calls_total, traces_spanmetrics_duration_seconds, traces_service_graph_request_total, as well as a few others. (Assuming the collector has already ingested a trace, otherwise /metrics doesn’t serve anything.)
Metrics
Until they figure out how they want to name the spanmetrics, the OTel Collector generated metric names aren’t compatible with the Grafana Views out of the box. For the time being, this can be corrected with metricRelabelings in our ServiceMonitor. The ServiceMonitor below scrapes the headless service every 30 seconds on the http-metrics port & renames metrics starting with traces_spanmetrics_duration_seconds_* to traces_spanmetrics_latency_*. Fortunately, the Service Graph Connector is based on Tempo’s service graph processor, so those metrics are compatible without any changes.
apiVersion: monitoring.coreos.com/v1
kind: ServiceMonitor
metadata:
  name: otel-collector-spanmetrics
spec:
  # point to the headless service
  selector:
    matchLabels:
      operator.opentelemetry.io/collector-service-type: headless
  endpoints:
    # port name should match the one defined in the collector CRD
    - port: http-metrics
      interval: 30s
      metricRelabelings:
      - sourceLabels: [__name__]
        targetLabel: __name__
        regex: 'traces_spanmetrics_duration_seconds(_bucket|_sum|_count)?'
        replacement: 'traces_spanmetrics_latency${1}'
Results
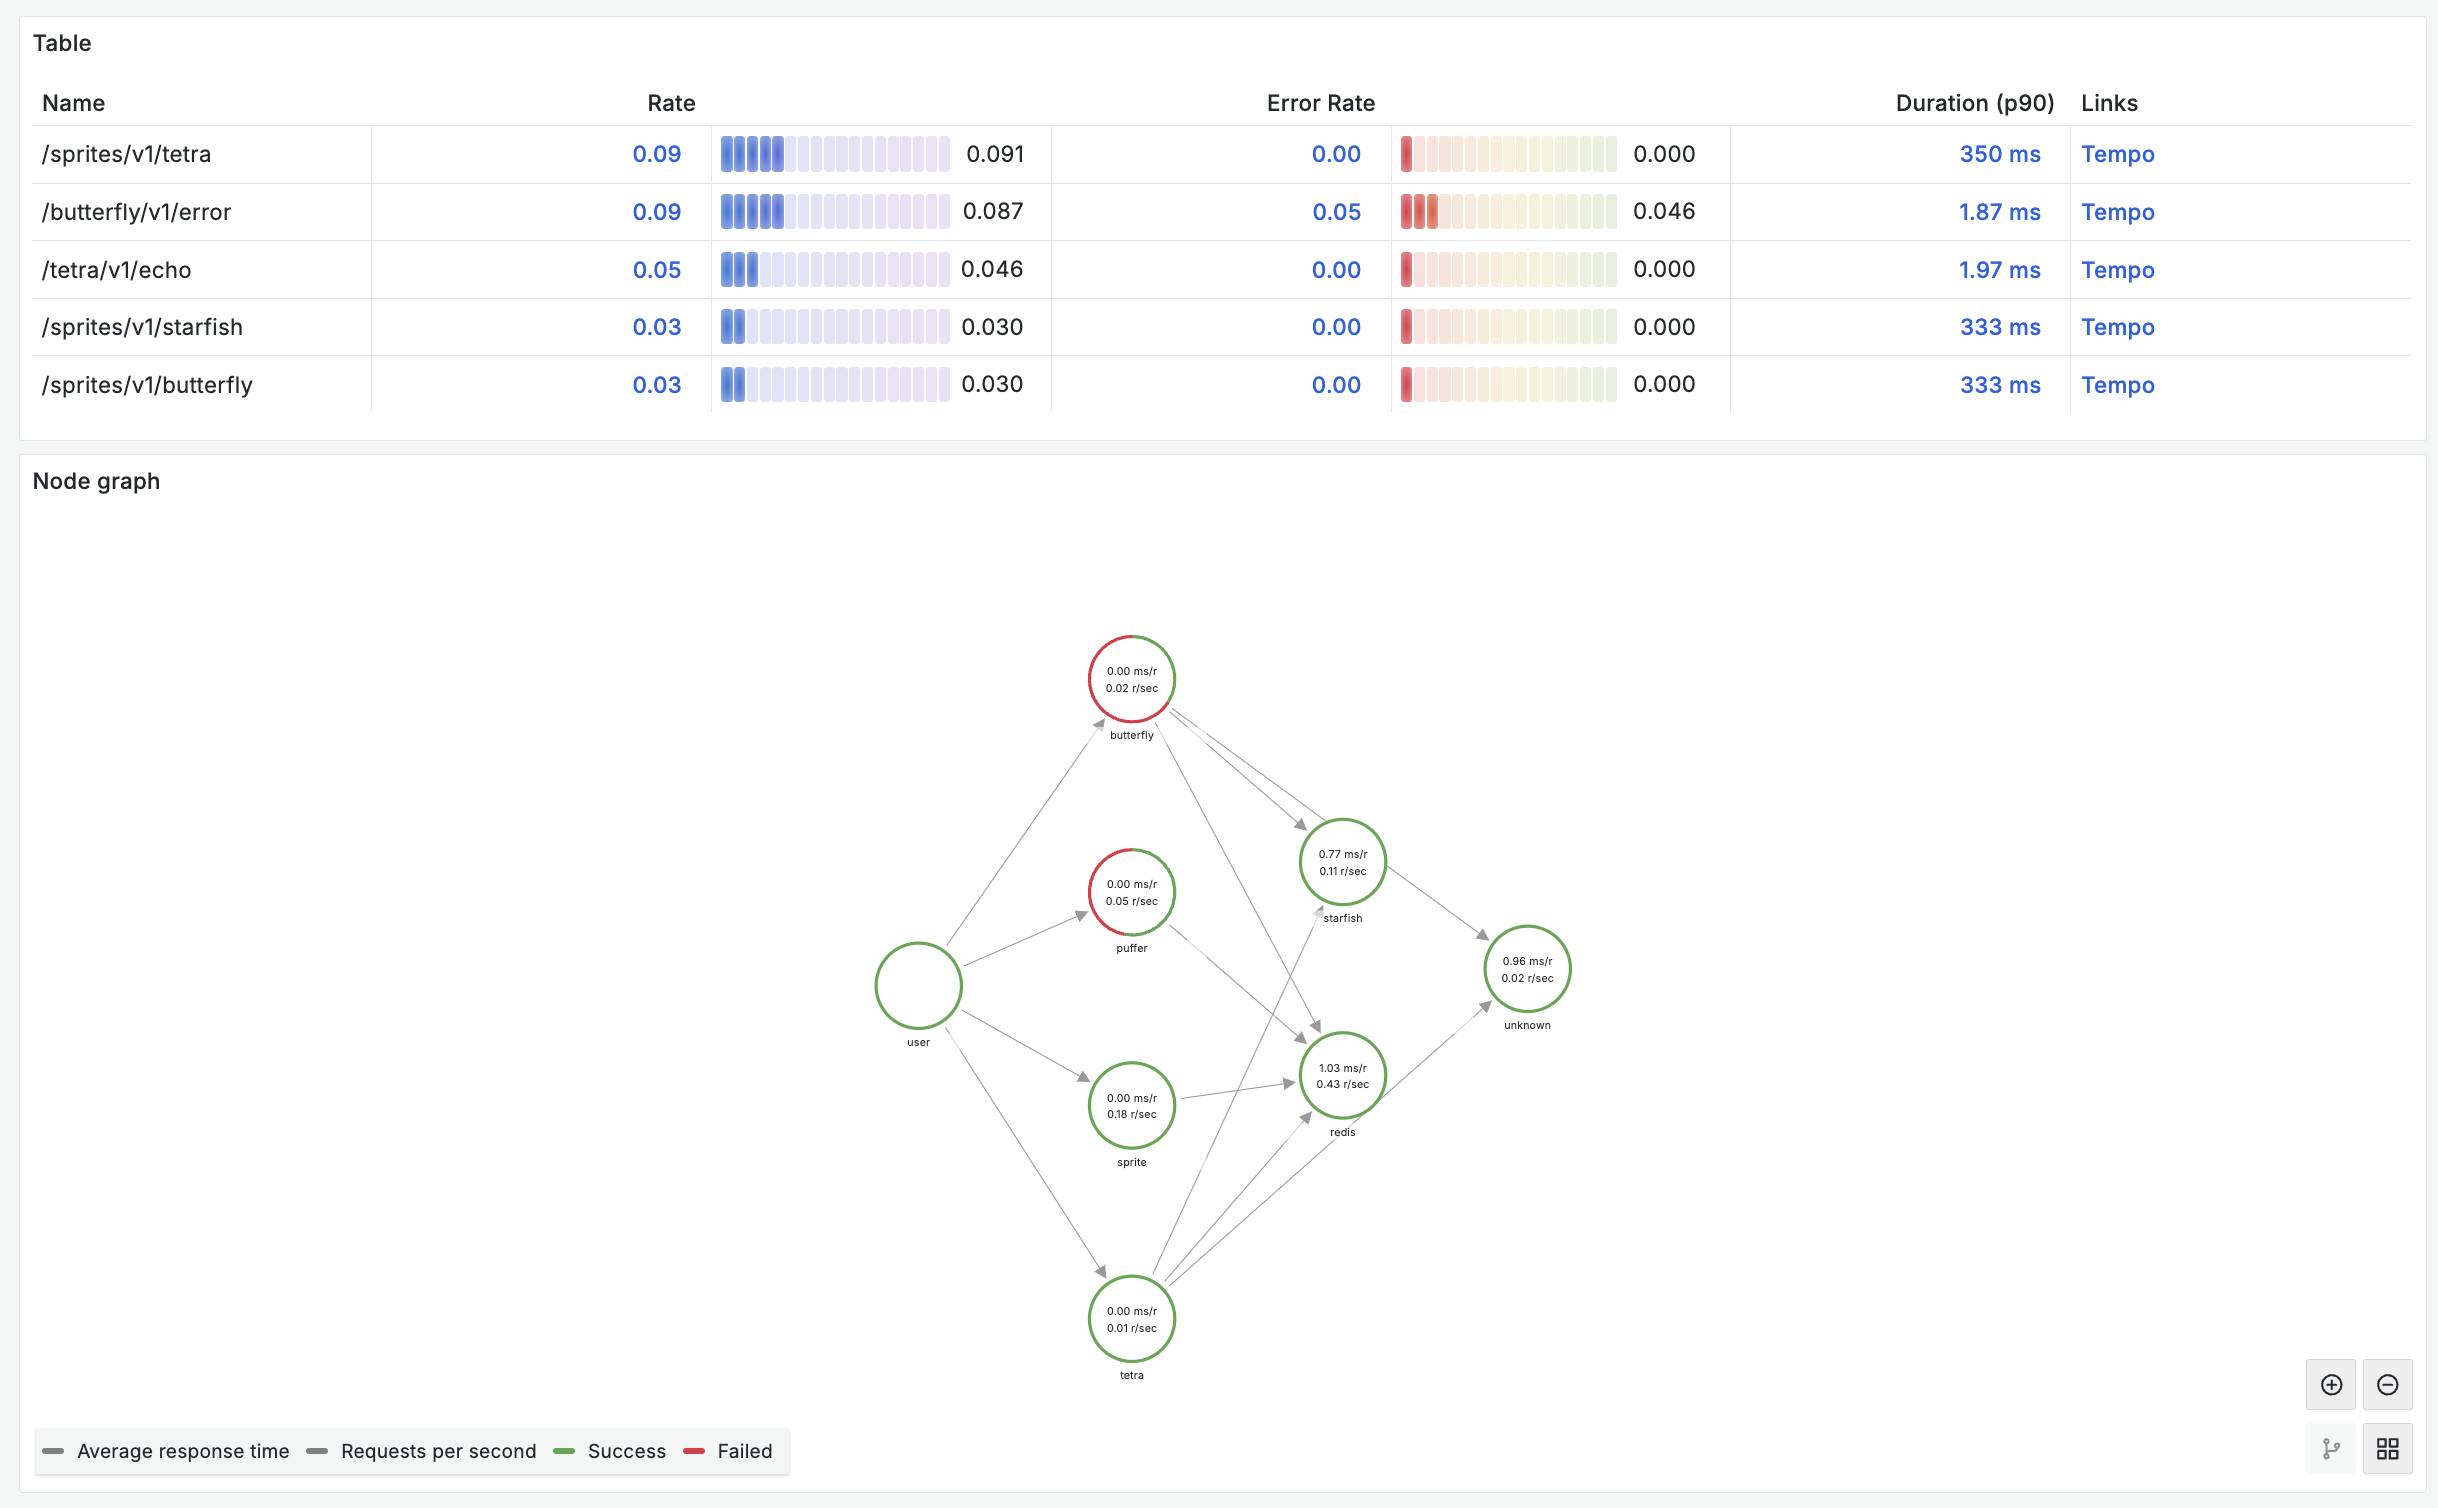
Send off some traces & after a while you should start seeing metrics and a graph show up in Grafana under Explore > Tempo > Service Graph.
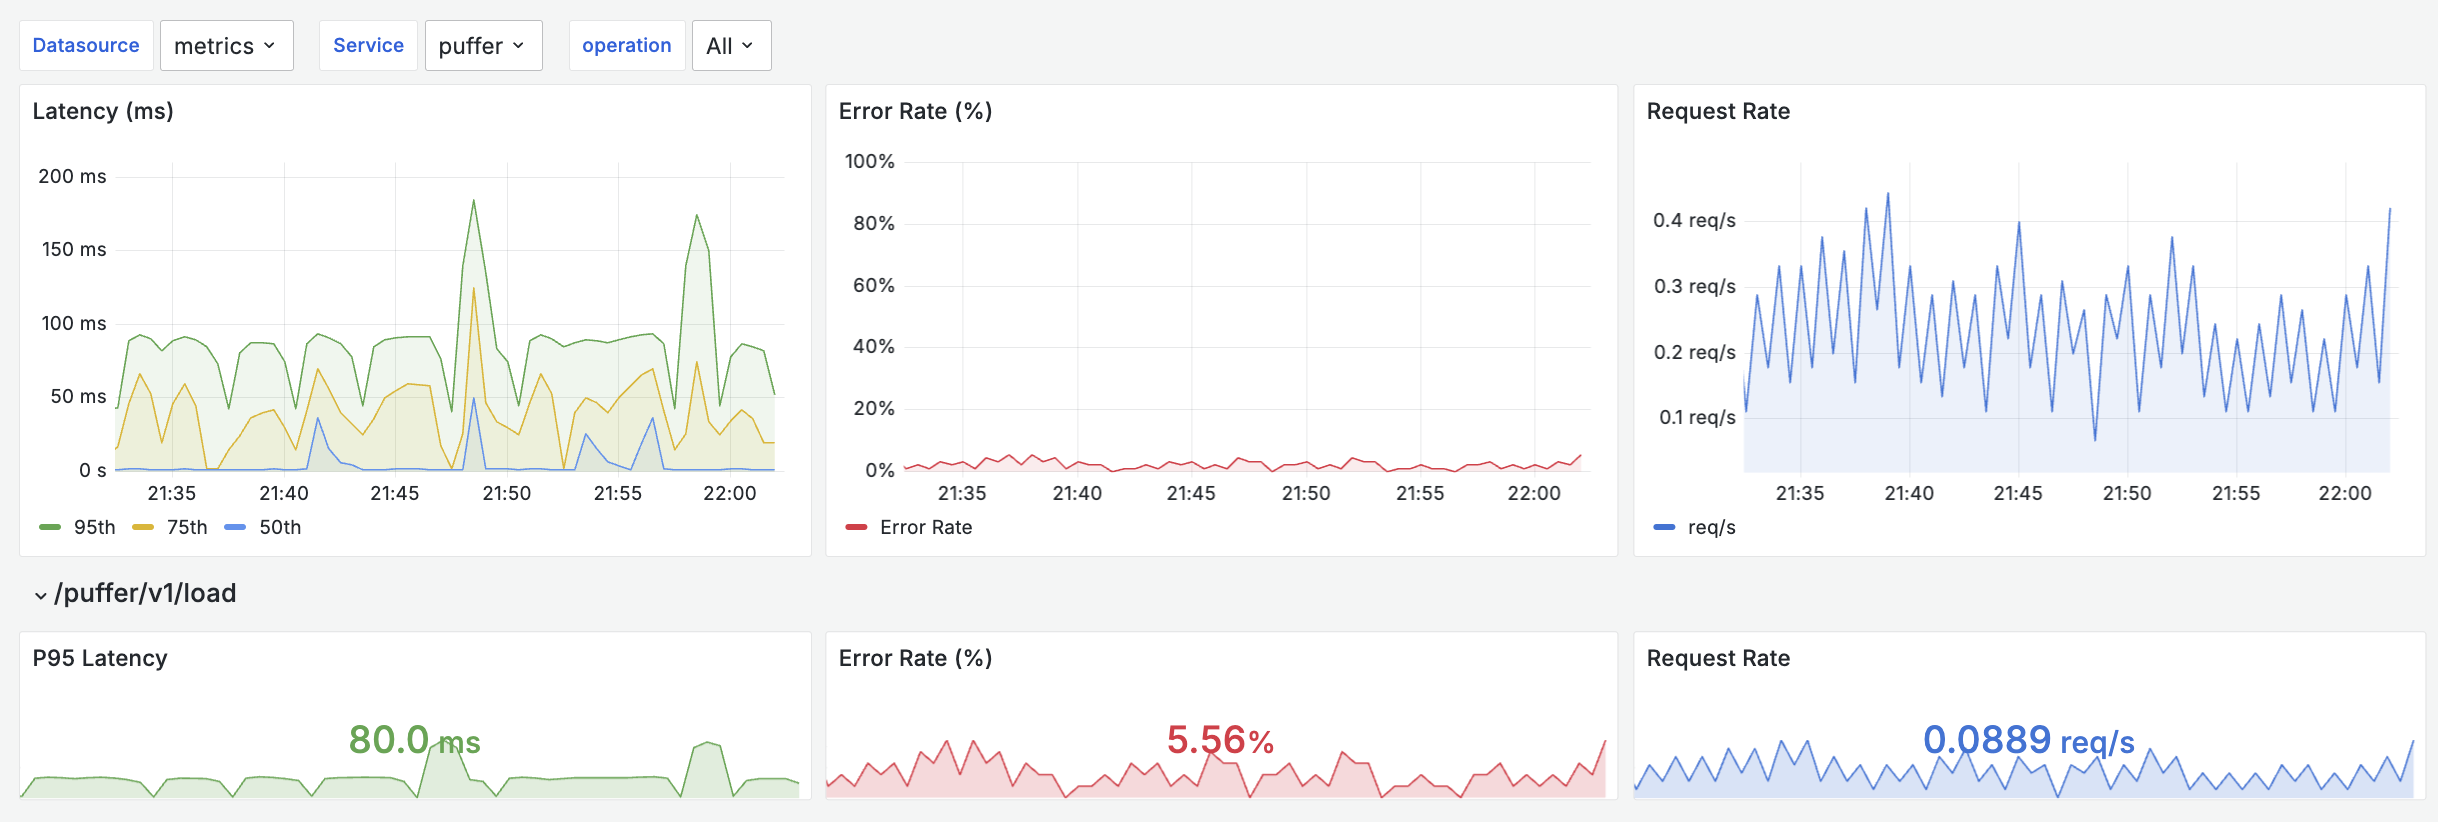
I also created a SPM Dashboard to get an overview of individual services & their operations (which are now called span.name) Get the Dashboard here: https://grafana.com/grafana/dashboards/21202
Thank you for reading! I will most likely do a similar post using Grafana Alloy to continue my journey of shilling Grafana Labs. 🔭 Happy Tracing! :)
![]()