This project was created in part of the fulfilment of my degree in Computing at the University of Central Lancashire. See the complete project report here & view the source on GitHub. A public instance of this project is available at: https://bonsai.konst.fish (uclan:bonsai).
Abstract
In the everchanging landscape of IT infrastructure, monitoring the health and performance of components is crucial to maintain steady uptime and service availability. Current monitoring systems can exhibit high latencies and complexity, potentially leading to an increased risk of system failure and a high amount of maintenance effort to keep each individual component running. This project’s goal is the creation of a dynamic and scalable solution capable of collecting metrics from any source. Thus, “Bonsai” a minimalistic monitoring system was developed. The primary objective of Bonsai was the creation of a complete monitoring system that gets metrics from a host to a dashboard as fast as possible. To achieve this, a multitude of methodologies were considered and implemented. The system was designed with a minimalistic approach, reducing each component of traditional monitoring systems to be as atomic as possible. This greatly helped to reduce the complexity of the system, making further expansion or changes to the components easy to achieve. Service oriented architecture was used to isolate components from each other as much as possible. This further helped to increase the simplicity of the project, and also allows for the system to be used for other tasks than originally planned. An example of this would be deploying the system without a frontend, converting it from a full monitoring system to an ingress engine. Bonsai’s achievements include the successful development of a complete monitoring system, featuring a set of example metrics exporters, an ingress server, a socket, and a frontend. Each component and the communication methodology between them were created to ensure rapid data processing, enabling near real-time visualisation of metrics from a server on a client’s dashboard. Due to the systems approach to services, modification and expansion is a possibility, making it possible for custom tailored solutions to be implemented. Data exporters can be written in a broad range of languages, to collect virtually any metrics. The server, used for metric ingress, is able to handle a multitude of exporters concurrently pushing data into the system. The socket is able to serve multiple clients concurrently without impacting any other system components performance. The frontend provides a pleasant user experience, while still maintaining a high grade of functionality. Each component was tested in a deployment, which accurately resembles real world conditions, in which the system proved itself to be a viable option for monitoring.
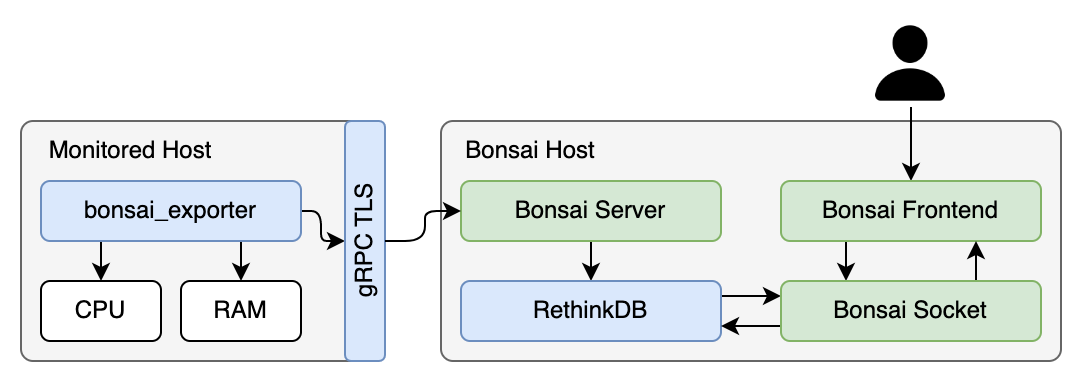
System Components
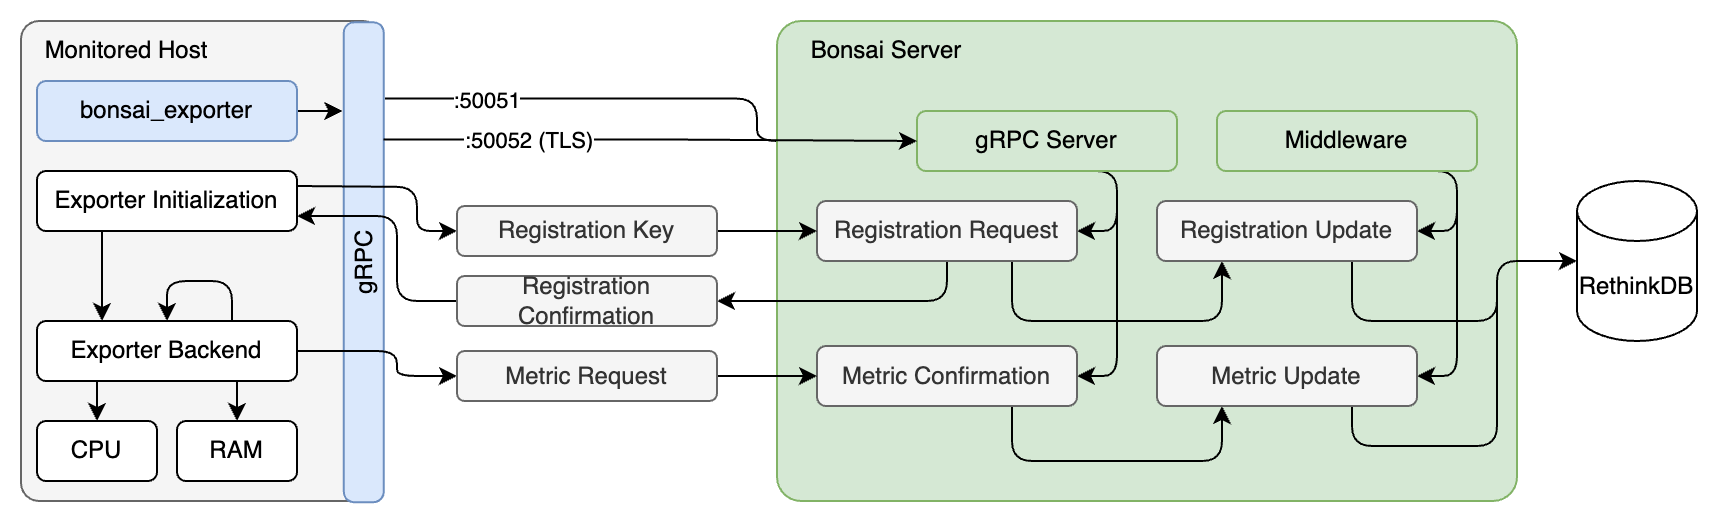
Server
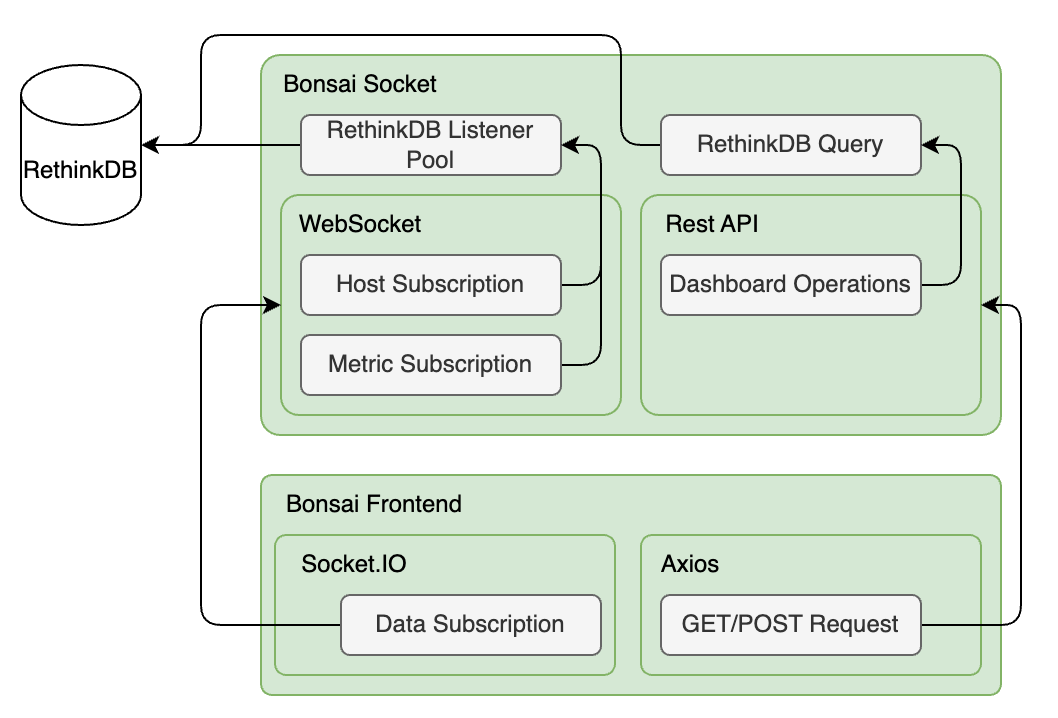
Socket
Frontend Overview
Home

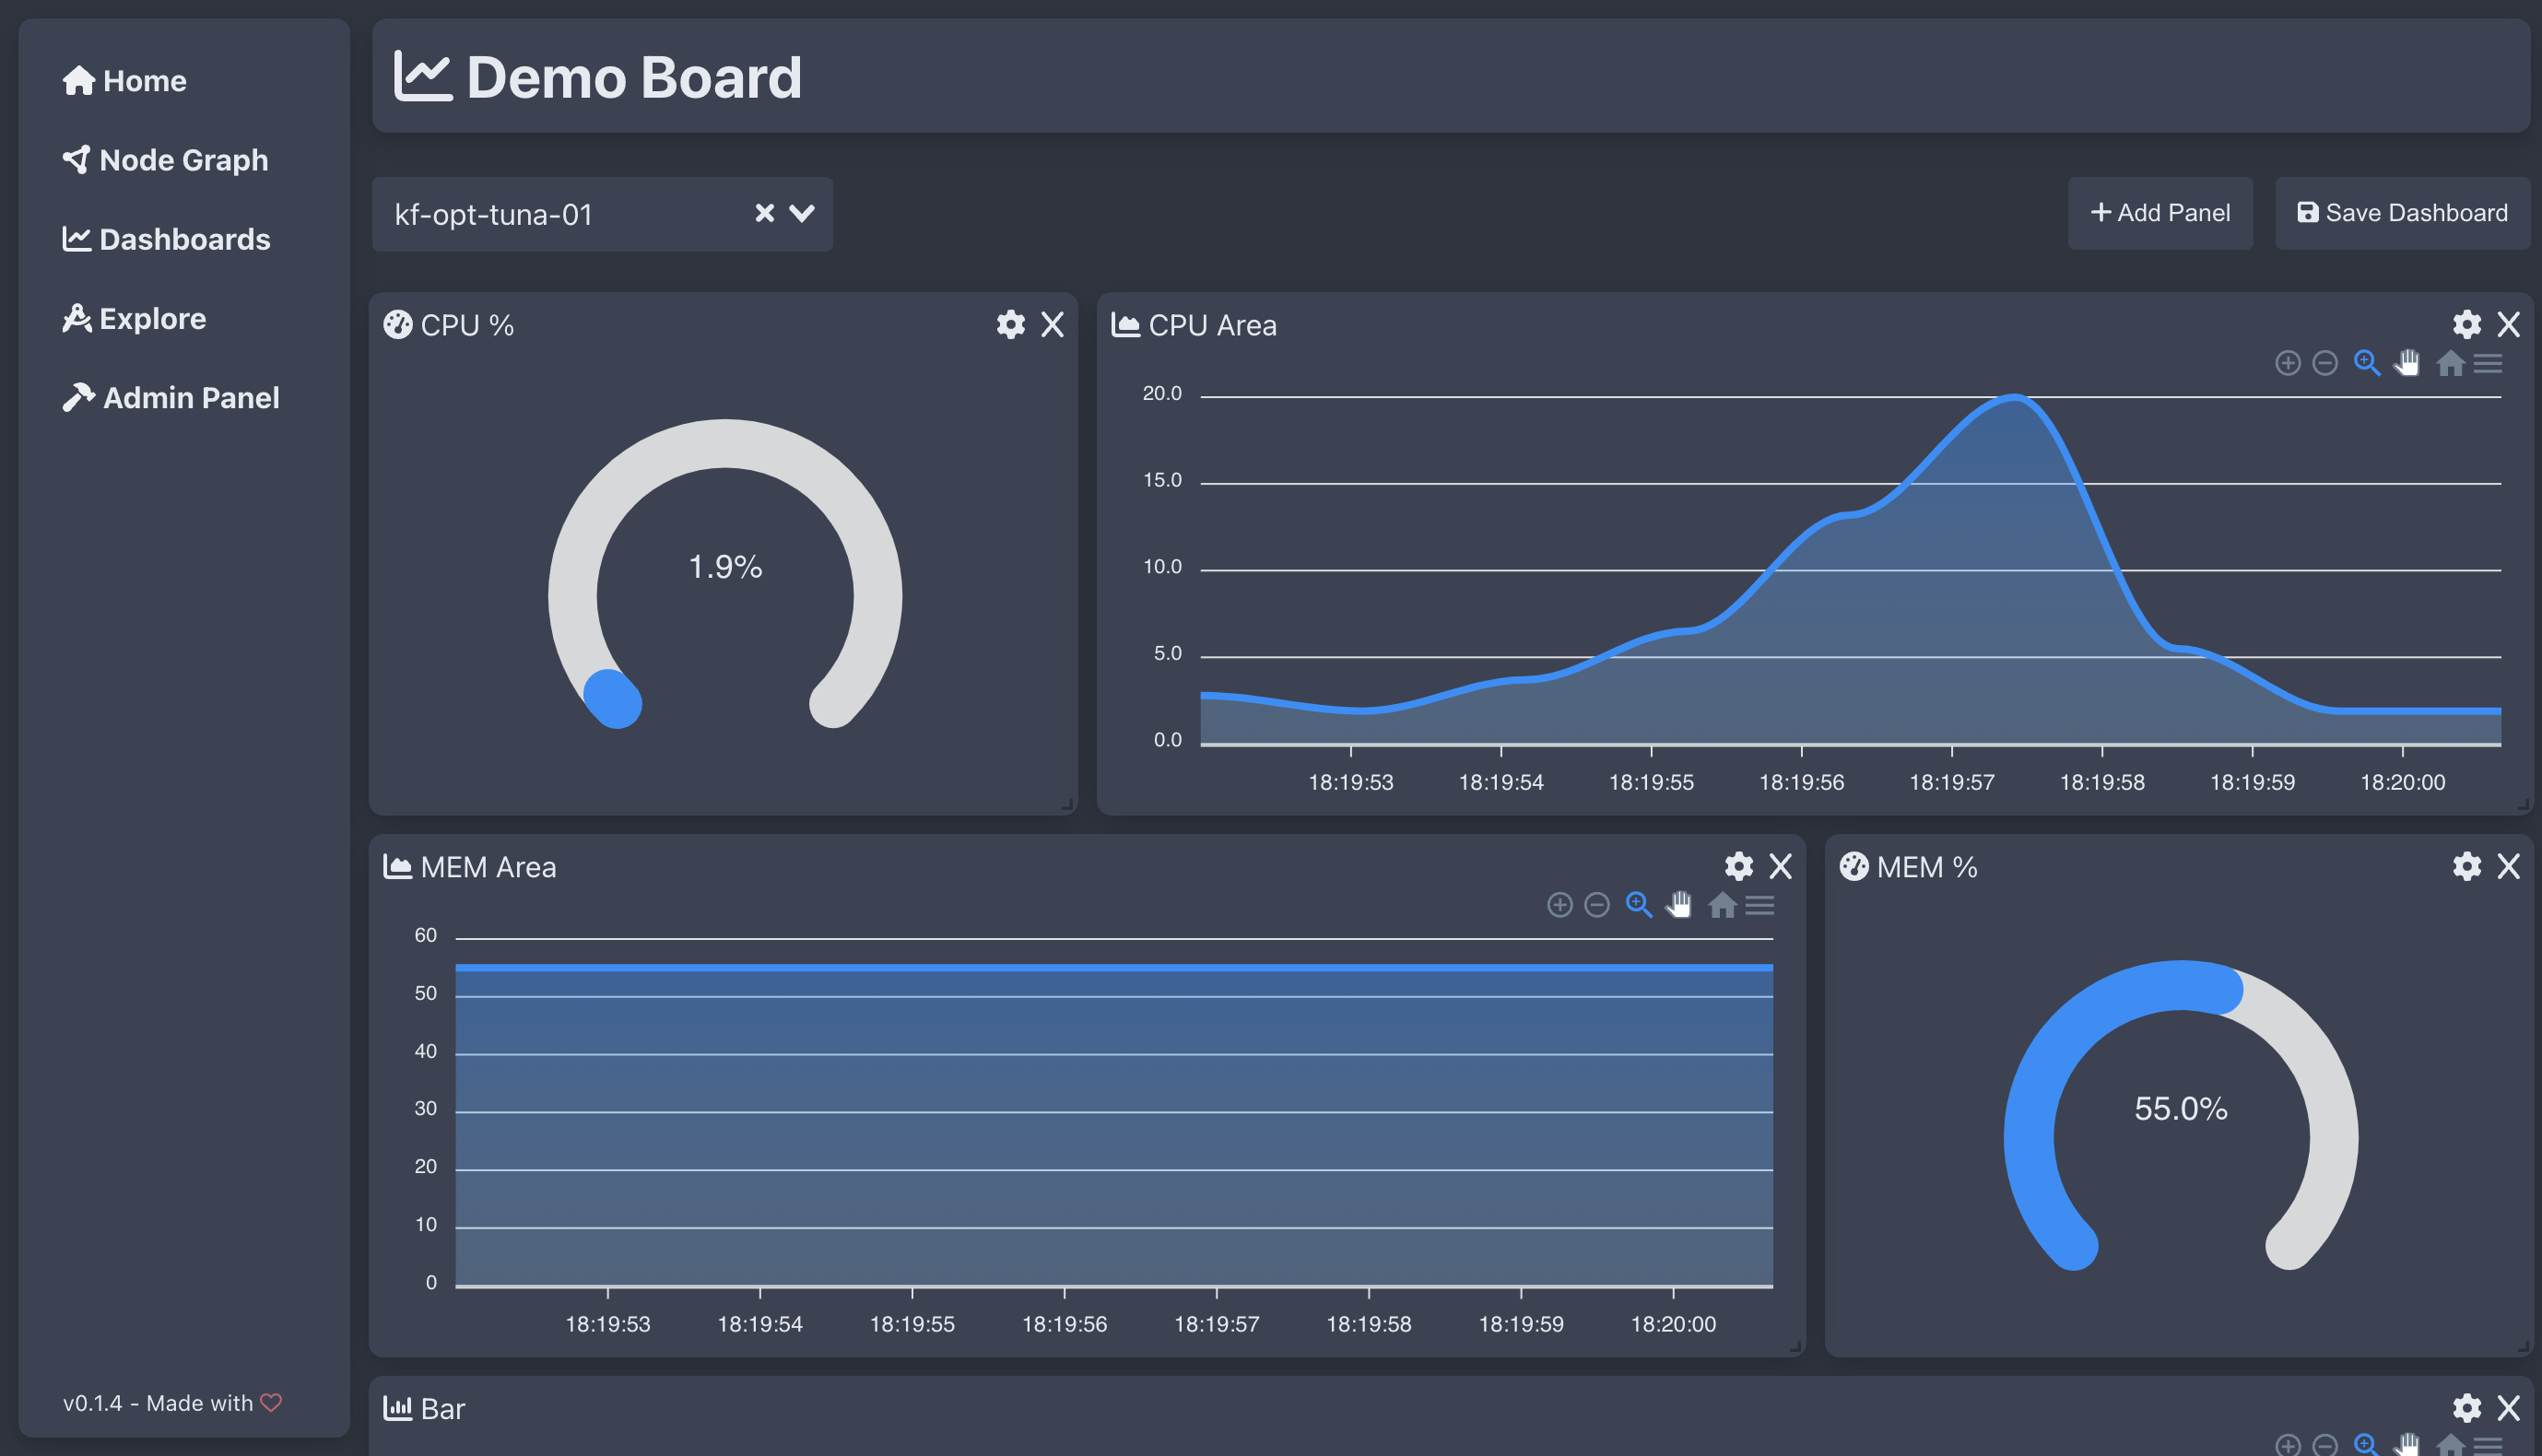
Example Dashboard
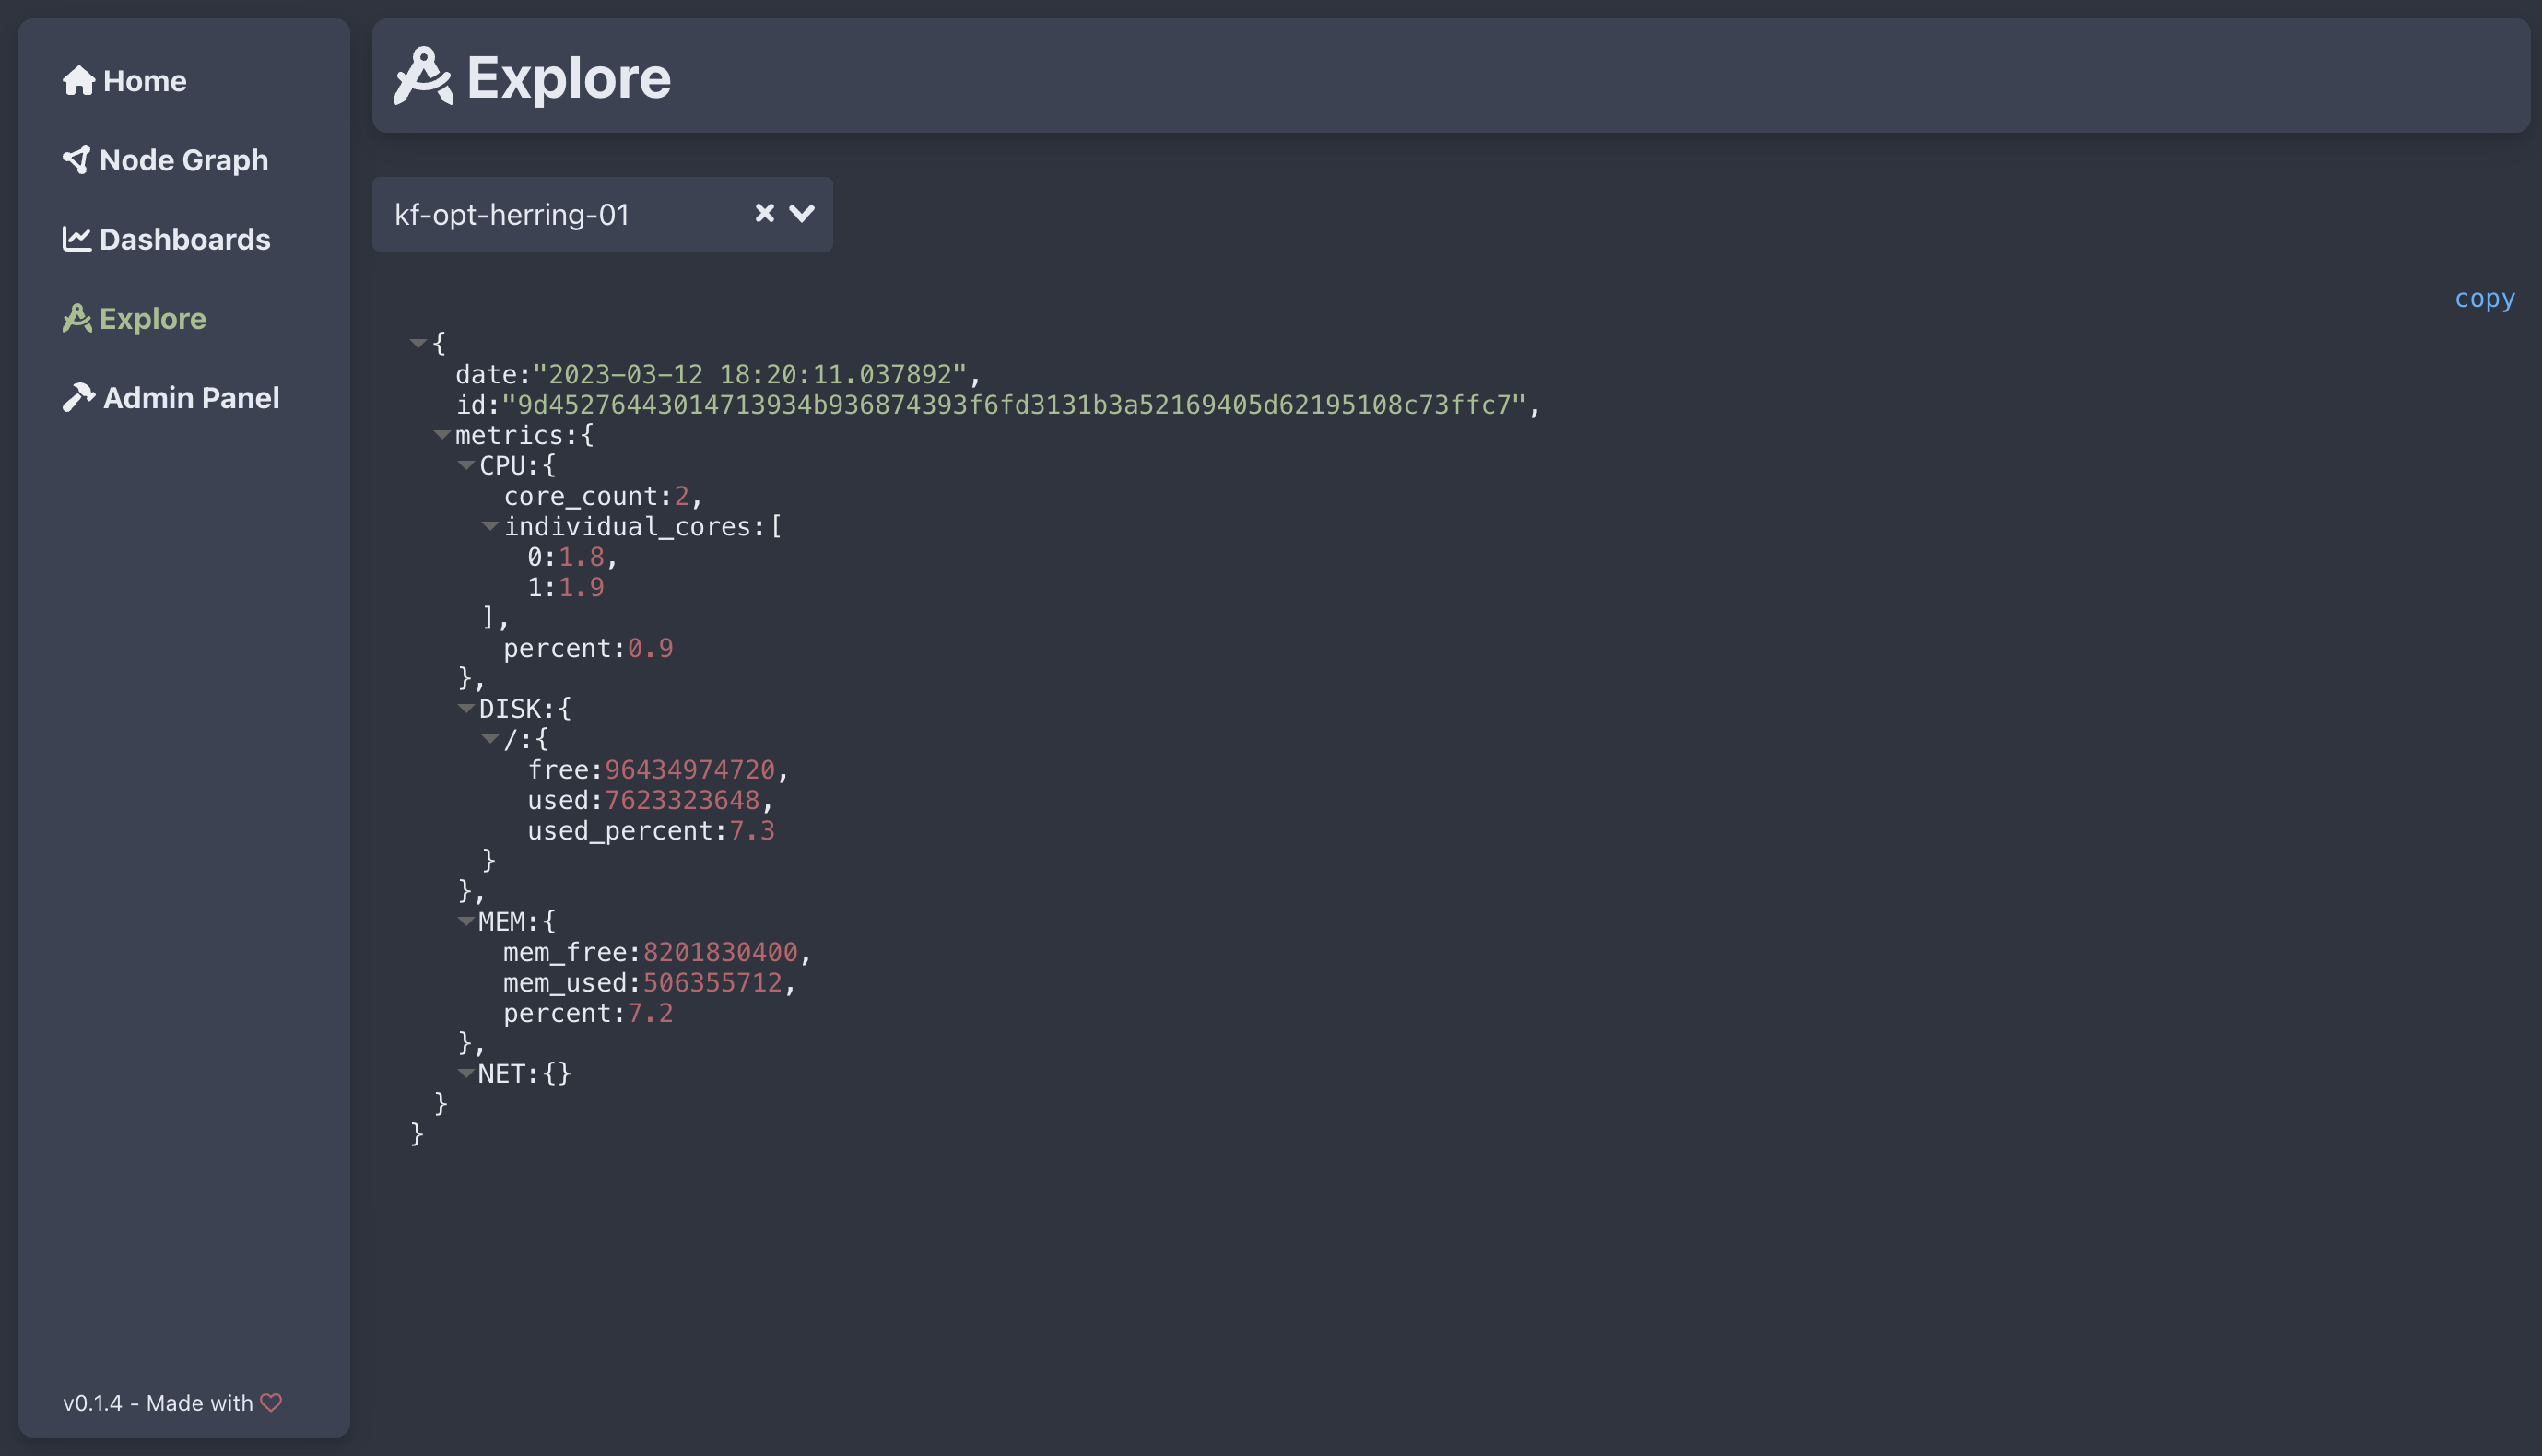
Explore