If you’ve read my post on Multi-Tenant Prometheus you’ll recognise most of the tools and methodology used for this logging setup. Just like with Prometheus, I decided on running a single cluster scope Loki instance with a custom querier frontend to provide isolated and secure access to logs. Loki has two key advantages over Prometheus in this context: 1. it is natively multi-tenant and 2. we can build the infrastructure in a way to have complete control over log ingestion.
Architecture Overview
Logs are collected by an Alloy DaemonSet, configured to only consider pods labeled with logging: enabled, and ingested by a Cluster Scope Loki Instance. Tenants query logs through a central query endpoint built with kube-rbac-proxy to handle Authentication. Note this setup can also be achieved with most other log collectors like Vector or Promtail.
flowchart LR
    A[Tenant] -->|1| grafana(Grafana)
    subgraph Tenant Namespace
        pod(Pod)
        qsa([Query Service Account]) <-.-> grafana
    end

    loki
    subgraph Monitoring Namespace
        subgraph Query Frontend
            grafana -->|2| krp(kube-rbac-proxy)
        end
        krp --->|6| loki
        loki(Loki)
        alloy(Alloy) --> loki
        alloy <-.-> pod
    end

    subgraph Kubernetes
        krp -->|3| sar{{SubjectAccessReview}}
        sar <-->|4| qsa
        sar -->|5| krp
    end
Setup
Loki
Since the Loki Operator is still very enterprise oriented (1x.extra-small needs 14c & 31gb of RAM!) I’ve been using the Helm Chart to bootstrap my instances. This blog post will assume a Loki instance with multi-tenancy enabled is already set up. Should this not be the case, you can find docs & working examples in the posts accompanying GitHub Repo.
Collection with Alloy
I recently migrated away from Promtail since it’s going to reach its EOL in early 2026, should you still want to use it, you can find a config which achieves the same result as the one for Alloy below here.
Alloy has a pretty great Helm Chart which can be used to configure a log collection DaemonSet. Outlining our goals, we want a log collector capable of identifying specific Pods to collect while giving us as much metadata on the Pods context as possible. For tenant separation, I chose namespaces (specifically their names), as they most likely already serve as your tenants boundaries.
Tenant Separation
Loki in multi-tenant mode will separate ingested logs by tenant for us automatically, the only requirement from the ingesters side is to tell Loki which tenant the log belongs to which can be done with a simple label.
Selecting Pods
In the example config, only Pods with a logging: enabled label are scraped. This allows tenants to manually select which Pods are relevant enough to require aggregated logging while also allowing admins to prevent noisy containers from increasing the storage bill per default.
Log Labels/Metadata
I like changing out the defaults to append extra labels to all logs, this makes it way easier to figure out exactly what Pod issues are occurring in. Some log collectors will already be configured to do this by default, for example Promtails Helm Chart values.yaml has an elaborate pipeline under config.snippets.common to append metadata like pod & node names, uid, namespace, container name as labels.
Config
See the complete config here, interesting sections are outlined below.
# snippet of alloy values.yaml

# create as a daemonset to scrape every single node
controller:
  type: daemonset

# we are only interested in container logs for this alloy deployment
mounts:
  varlog: false
  dockercontainers: true

# alloy config, unfortunately not yaml
alloy:
  configMap:
    create: true
    content: |
      // discover all pods
      discovery.kubernetes "pod" {
        role = "pod"
      }

      discovery.relabel "pod_logs" {
        targets = discovery.kubernetes.pod.targets

        // only scrape logs from pods with logging enabled label
        rule {
          source_labels = ["__meta_kubernetes_pod_label_logging"]
          regex = "enabled"
          action = "keep"
        }

        // append additional labels
        rule {
          source_labels = ["__meta_kubernetes_pod_node_name"]
          action = "replace"
          target_label = "node_name"
        }

        // [...] more relabel/source rules omitted, see the full config at the link above
      }

      // endpoint of our log ingester, forwarding rules/pipeline omitted
      loki.write "default" {
        endpoint {
          url = "http://loki-gateway/loki/api/v1/push"
        }
      }

      // required for multi-tenancy, we need to tell Loki which tenant the log line belongs to
      // to achieve this, we add a tenant label, setting the content to the name of the
      // originating namespace. Loki will interpret this for us and store the line accordingly
      loki.process "pod_logs" {
        stage.cri {}

        // extract namespace name & set as tenant label
        stage.match {
          selector = "{namespace=~\".+\"}"
          stage.tenant {
            label = "namespace"
          }
        }

        forward_to = [loki.write.default.receiver]
      }
Once Alloy is set up & running, you should be able to query Loki with an X-Scope-OrgID header containing a tenant namespaces name as the value. This will return all ingested logs from that specific namespace & only that namespace.
Great! Now how do we make this secure?
Querier Frontend
The querier frontend can be deployed as a single Pod and scaled to any amount of replicas, the only external dependency being SubjectAccessReviews to delegate authorization decisions to the Kubernetes API server. This enables us to treat access to Lokis stored logs like we would any other Kubernetes resource, only allowing Users or ServiceAccounts with the correct permissions to query.
Requests to the querier frontend will always have to carry a valid Bearer token and an X-Scope-OrgID header. kube-rbac-proxy checks if the request originator (sourced from the JWT) has permissions on the pods/logs subresource in the namespace defined in the X-Scope-OrgID header. Should the SubjectAccessReview succeed, the request is passed to Loki, retaining all headers and confirming access rights in the process.
flowchart LR
    subgraph Tenant Namespace
        qsa([Query Service Account]) <-.-> grafana(Grafana)
    end

    subgraph Kubernetes
        sar{{SubjectAccessReview}}
    end

    tnt[Tenant] -->|1 - Query Logs| grafana
    grafana -->|2 - SA JWT & X-Scope-OrgID=tenant| krp(kube-rbac-proxy)

    subgraph Monitoring Namespace
        subgraph Query Frontend
            krp(kube-rbac-proxy)
            krp -->|3 - Validate SA Perms| sar
            sar -->|4 - Confirm Access| krp
        end

        krp -->|5 - Expects X-Scope-OrgID Header| loki

        loki(Loki)
    end
Config
The complete config for the querier frontend can be found here, as well as some additional information & manifests. The interesting sections are outlined below.
The entire logic for the kube-rbac-proxy is defined in just nine lines. It retrieves the X-Scope-OrgID header & uses it to construct a SubjectAccessReview for the given namespace to make sure the requester has rights to the pods/logs subresource. The verb will correspond the http method used for the request.
apiVersion: v1
kind: ConfigMap
metadata:
  name: loki-kube-rbac-proxy
data:
  config.yaml: |+
    authorization:
      # setup our template by extracting the value of the
      # X-Scope-OrgID header (-> the tenant namespace name)
      rewrites:
        byHttpHeader:
          name: "X-Scope-OrgID"
      # define a template for the SubjectAccessReview
      resourceAttributes:
        apiVersion: v1
        resource: pods
        subresource: logs # pods/logs subresource
        namespace: "{{ .Value }}" # value from rewrite above
Service Account
To create SubjectAccessReviews, the kube-rbac-proxy requires elevated rights. Fortunately Kubernetes provides a ClusterRole system:auth-delegator for this exact use case.
apiVersion: v1
kind: ServiceAccount
metadata:
  name: loki-kube-rbac-proxy
---
apiVersion: rbac.authorization.k8s.io/v1
kind: ClusterRoleBinding
metadata:
  name: loki-kube-rbac-proxy
roleRef:
  apiGroup: rbac.authorization.k8s.io
  kind: ClusterRole
  name: system:auth-delegator
subjects:
  - kind: ServiceAccount
    name: loki-kube-rbac-proxy
    # assuming this is being deployed in the monitoring NS
    namespace: monitoring
Deployment
The deployment is kept pretty simple, as we only need to pass a few arguments to the kube-rbac-proxy container. Covering the config, kube-rbac-proxy will listen (securely) on port 3100, forwarding incoming requests to localhost:8080 (the prom-label-proxy). We also need to mount the config created in the configmap above as a file. prom-label-proxy only needs four options, the listen address, the label to enforce, a flag to enable the label APIs, and the upstream (which can be a single Prometheus, a Thanos Sidecar, or a Thanos Querier.)
kind: Deployment
# [...]
      # use the service account from above w/ the `system:auth-delegator` role
      serviceAccountName: loki-kube-rbac-proxy
      containers:
      - name: kube-rbac-proxy
        image: quay.io/brancz/kube-rbac-proxy:v0.18.1
        args:
	        # use the secure listen address to make future cert expansion easier
          - "--secure-listen-address=0.0.0.0:3100"
          # set the upstream to your loki gateway service address
          - "--upstream=http://loki-gateway.monitoring.svc.cluster.local/"
          # load the config from a configmap
          - "--config-file=/etc/kube-rbac-proxy/config.yaml"
        volumeMounts:
          - name: config
            mountPath: /etc/kube-rbac-proxy
        # [...]
      volumes:
        - name: config
          configMap:
            name: loki-kube-rbac-proxy
# [...]
Usage
Testing
Once Loki, your collector, and the query frontend are set up and running & you’ve ingested a few logs we can start testing the setup. The easiest way to do this is with a quick Grafana instance.
Note most of this is taken straight from my multi-tenant Prometheus post, with minor exceptions regarding RBAC/Loki Datasource specifics. If you already set up Prom like this, you can skip a lot of these steps and use the same ServiceAccount.
First we’ll need to do a little setup in the tenant namespace (which we’ll call “showcase” from this point onwards). Create a ServiceAccount & Role which matches the rights in the kube-rbac-proxy config.
apiVersion: rbac.authorization.k8s.io/v1
kind: Role # Could also be a ClusterRole
metadata:
  name: namespace-logs-viewer
rules:
- apiGroups: [""]
  resources:
  - pods/logs
  verbs: ["get"]
---
apiVersion: v1
kind: ServiceAccount
metadata:
  name: grafana-ds-sa
---
apiVersion: rbac.authorization.k8s.io/v1
kind: RoleBinding
metadata:
  name: grafana-sa-logs-viewer
roleRef:
  apiGroup: rbac.authorization.k8s.io
  kind: Role
  name: namespace-logs-viewer
subjects:
- kind: ServiceAccount
  name: grafana-ds-sa
  namespace: showcase
To confirm this ServiceAccount has the correct permissions, you can run kubectl auth can-i get pod --subresource=logs --as=system:serviceaccount:showcase:grafana-ds-sa
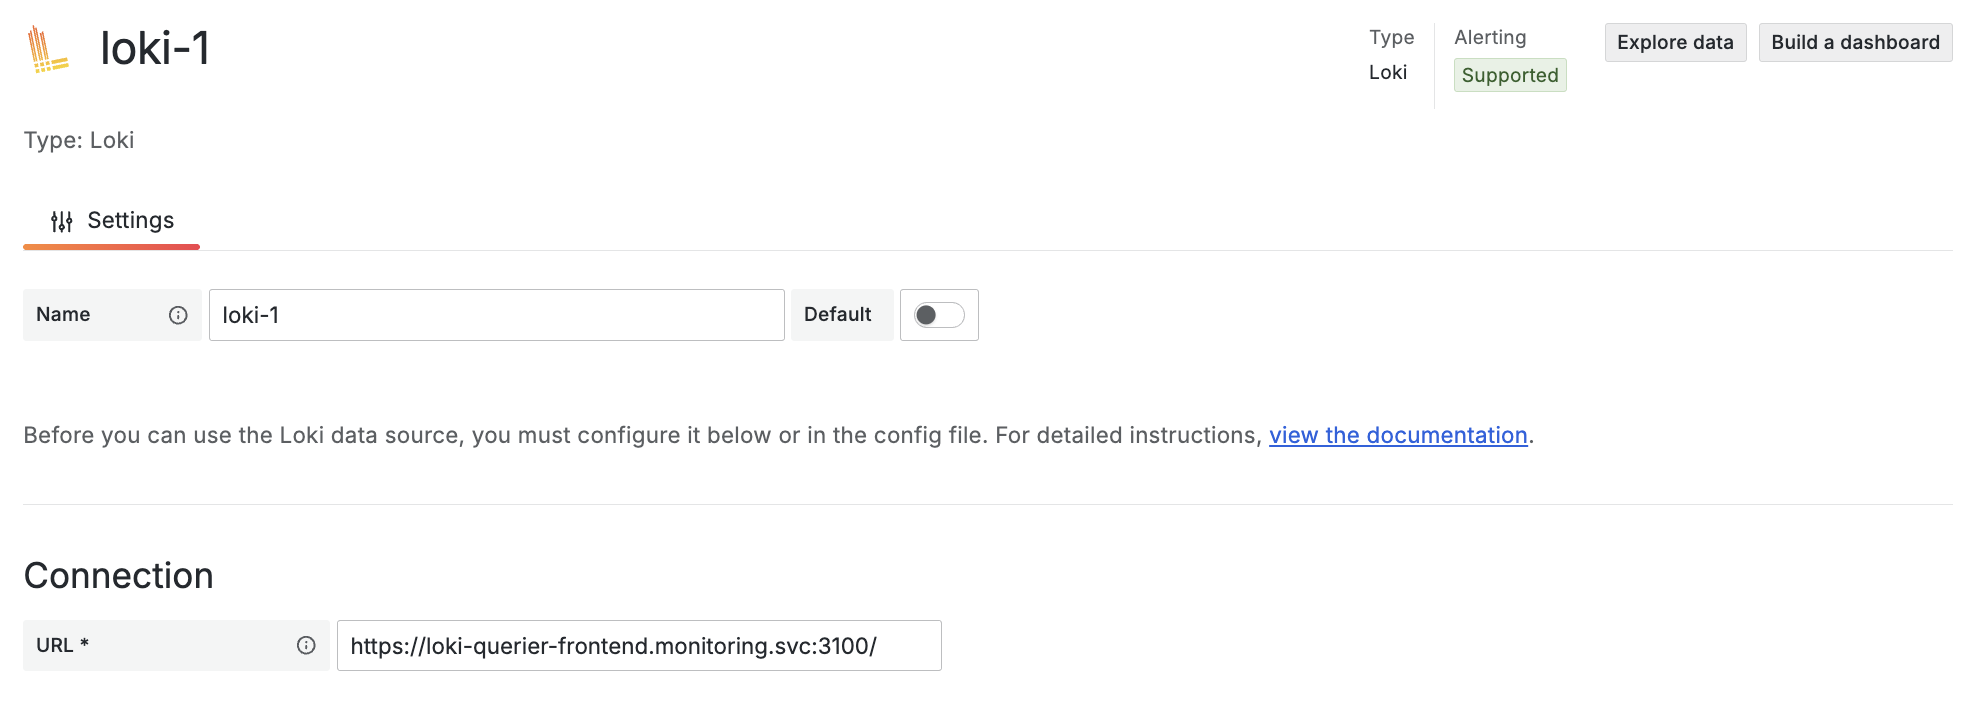
In Grafana, create a new Loki Datasource & point it to your querier frontends service, making sure to use https.
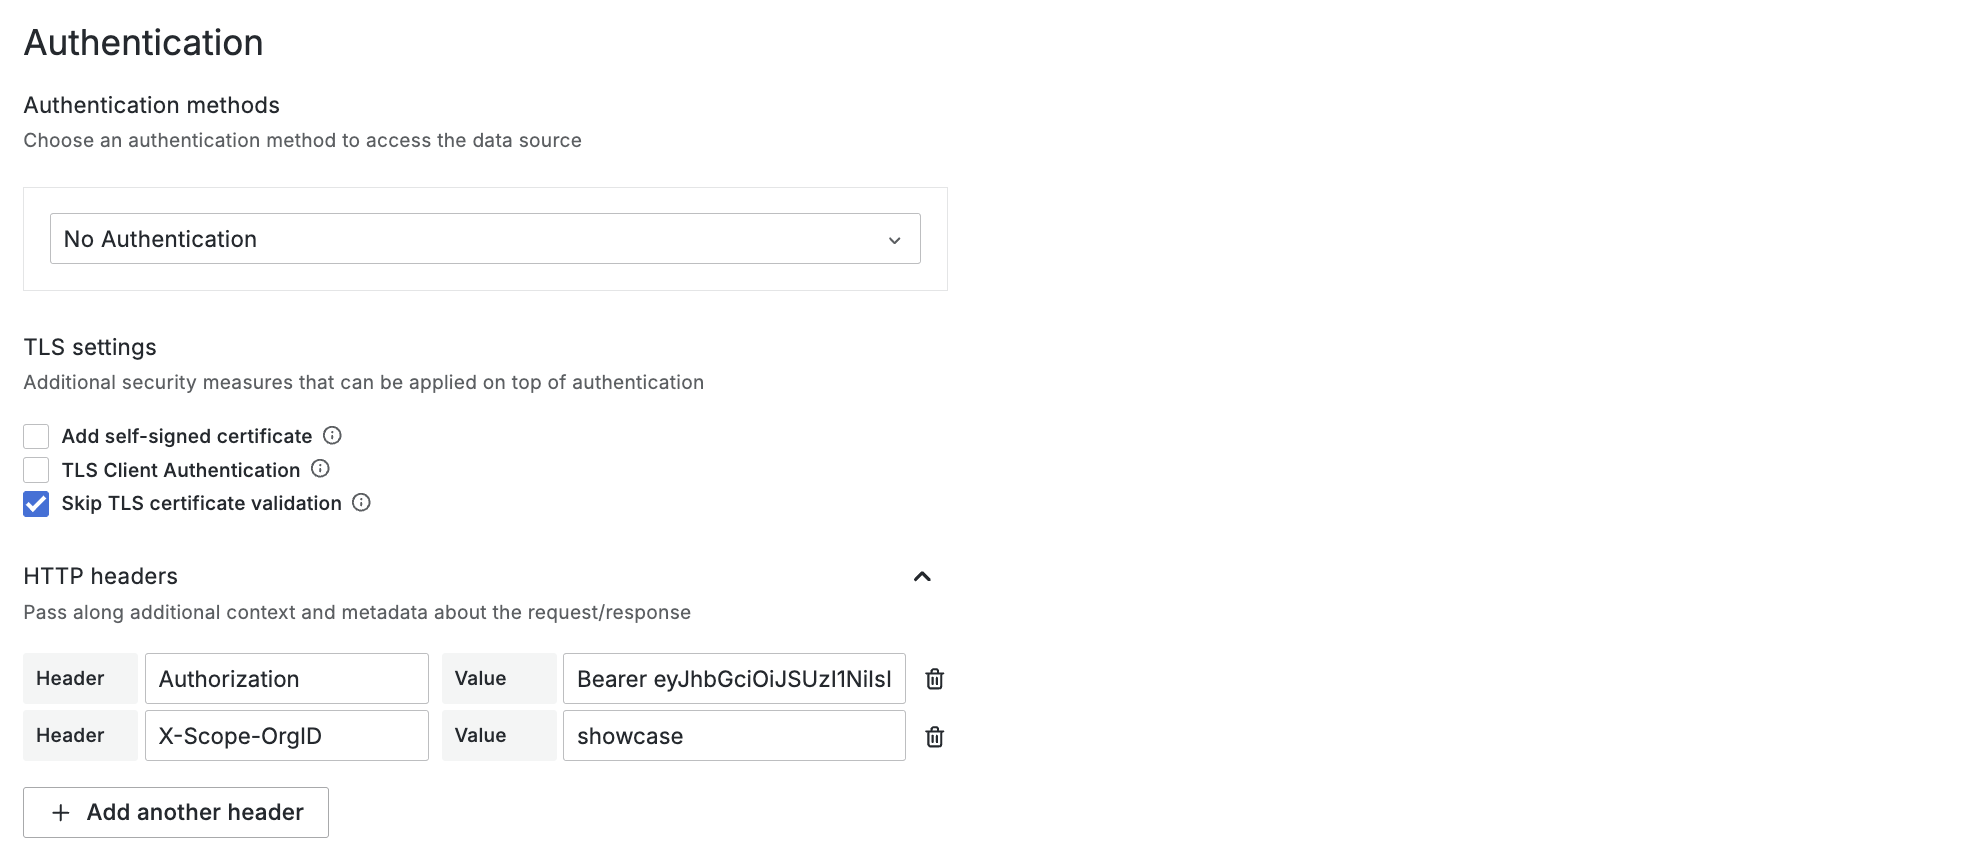
Under Authentication > TLS Settings, turn on “Skip TLS certificate validation” & create two headers. One X-Scope-OrgID containing the tenant namespace name, “showcase” in this case. Second Authorization containing Bearer ${token}, ${token} being the previously created service accounts JWT. You can retrieve it by running kubectl create token grafana-ds-sa
Save the datasource & confirm correct configuration.
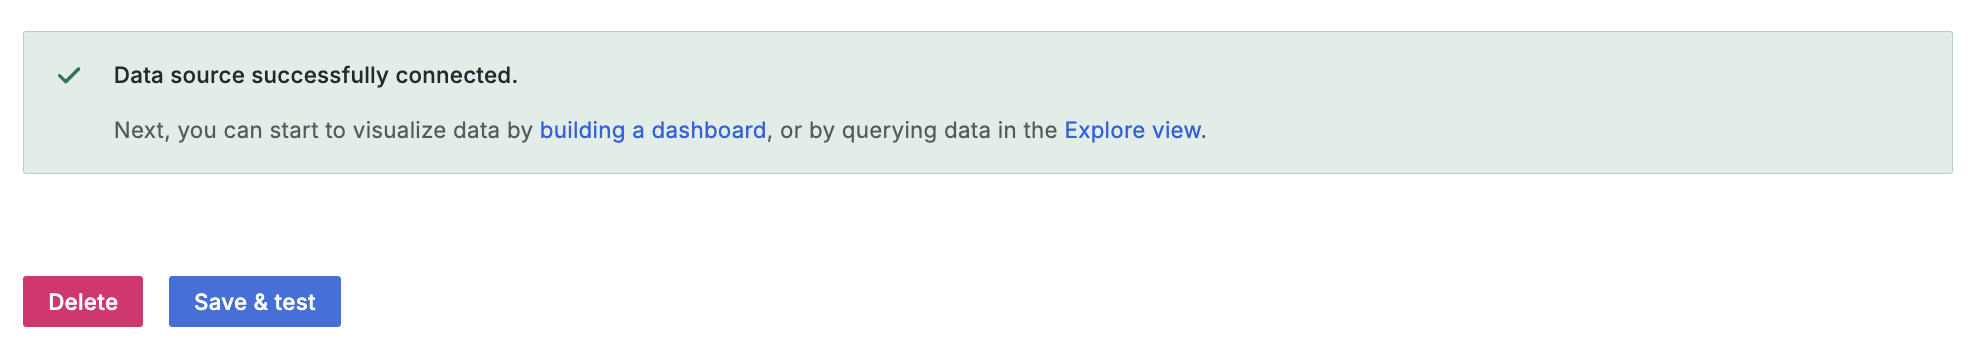
Finally after constructing the request in a way which fulfils all requirements defined earlier in the querier frontend, we can test the datasource. You’ll notice any changes to this config will result in the request being rejected with a 401, try using a different ServiceAccounts token or changing the value of the namespace query parameter. In the “Explore” view, you should be able to query logs and confirm the isolation by checking which values are available for the “namespace” label.

Production
For production (& to improve your tenants DevEx) we’ll automate all of these steps. The Grafana Operator will make this considerably easier, with each tenant managing their own instance. I usually provide all of this as a simple helm chart, which sets up all required manifests in tenant namespaces.
To get started, bootstrap a Grafana Instance using the Operator & create the ServiceAccount/Bindings from earlier. Additionally, we’ll create a secret to house the ServiceAccounts token & a GrafanaDatasource CRD to automatically provision the Prometheus DS.
Secret
apiVersion: v1
kind: Secret
metadata:
  name: grafana-ds-sa-token
  annotations:
    # references the ServiceAccount, kubernetes will automatically
    # populate this secret for us
    kubernetes.io/service-account.name: grafana-ds-sa
type: kubernetes.io/service-account-token
Grafana Datasource
apiVersion: grafana.integreatly.org/v1beta1
kind: GrafanaDatasource
metadata:
  name: logs
spec:
  # make sure this matches your Grafana CRD
  instanceSelector:
    matchLabels:
      app: grafana
  # import the token from the secret to be used in secureJsonData below
  valuesFrom:
    - targetPath: secureJsonData.httpHeaderValue1
      valueFrom:
        secretKeyRef:
          key: token
          name: grafana-ds-sa-token
  # set up datasource, this spec the same one Grafana itself uses to manage datasources,
  # so you can also extract it from the network requests when creating/editing one in the UI
  datasource:
    name: logs
    type: loki
    uid: loki1
    access: proxy
    # make sure this matches your services name & namespace
    url: "https://loki-querier-frontend.monitoring.svc:3100/"
    isDefault: false
    editable: false
    jsonData:
      # set the auth & OrgID headers, values are populated below
      httpHeaderName1: Authorization
      httpHeaderName2: X-Scope-OrgID
      queryTimeout: 5m
      timeout: 600
      manageAlerts: false
      # disable once proper serving certificates for the querier frontend have been set up
      tlsSkipVerify: true
    secureJsonData:
      # template in the Bearer token value from the secret reference above
      httpHeaderValue1: "Bearer ${token}"
      # specify the tenant namespace name here
      httpHeaderValue2: "showcase"
After a few seconds this datasource should show up in the Grafana Instance, ready to be queried.
Wrapping up
With this setup, tenants are able to easily enable log aggregation for their services by adding a single label to their Pods. They get isolated access to Loki, securely separated from other tenants. The querier frontend can be scaled to any required amount of replicas to guarantee query performance to avoid any slowdown introduced through the extra step.
Other Notes
Thank you for reading! 📃 Happy (multi-tenancy enabled) logging! :)
I’ve appended some thoughts below which didn’t fit the scope of this post but should still be considered in a production deployment.
Network Access
To make this a little more secure, the querier frontend could be deployed in a different namespace to isolate it further from the Loki deployment. In either case, NetworkPolicies should be used to ensure Loki can only be queried through the frontend, not directly.
Multiple Tenant Namespaces
Should your tenant have multiple namespaces, this same setup can still be used. Tenants can maintain a single Grafana Instance & simply give their Datasource ServiceAccount the required permissions in any additional namespaces. The only unfortunate downside is that a new Datasource needs to be created for every single namespace as the X-Scope-OrgID can’t be a list or dynamic*.
Serving Certificates
The kube-rbac-proxy doesn’t have any serving certs defined but still uses the secure listen address. This means clients will have to skip TLS certificate validation until a certificate is added to the deployment (which can be done with --tls-cert-file and other parameters found in the kube-rbac-proxy documentation.)
Enterprise (OpenShift)
This exact setup can also be replicated in an enterprise environment using the OpenShift Cluster Logging Operator. ClusterLogForwarder CRDs, which create collectors using Vector, can be configured the same way as Alloy to make sure logs are properly ingested.
Query Multiple Tenants at Once
To query multiple tenants, you’ll need to enable the functionality in Loki using multi_tenant_queries_enabled: true. Unfortunately, this functionality can’t be supported by the query frontend, as we rely on the X-Scope-OrgID header to be exactly one namespace name to build the SubjectAccessReview, so this is more of an admin util than anything else.
You can build a list of namespaces to query with the following commands (these can get pretty big, just make sure you stay under the 1MB limit):
Only NS w/ Pods that have logging=enabled labels: kubectl get pods --all-namespaces -o json | jq -r '.items[] | select(.metadata.labels.logging == "enabled") | .metadata.namespace' | sort -u | tr '\n' '|' | sed 's/|$//'
All NS: kubectl get namespaces --no-headers -o custom-columns=":metadata.name" | tr '\n' '|' | sed 's/|$//'
failed to create fsnotify watcher: too many open files
This is most likely related to your nodes max open file descriptors for regular users being too low. If you have your nodes in an ansible inventory you can quickly patch all of them using ansible all -m shell -a "sudo sysctl fs.inotify.max_user_instances=1024" -u root
This will raise the amount to 1024 which should be more than enough for Alloy to reliably scrape all logs, but is also more or less just a duct tape fix.
![]()