There’s multiple ways to set up multi-tenant monitoring with Prometheus, most of which are covered in this great talk. For my setup, I decided on running a central Prometheus to scrape every tenant on a single Cluster with a querier frontend to provide isolated access to metrics. This makes it easy to get a more holistic view of all cluster and tenant metrics while also lowering the overall complexity and barrier to entry for tenants. If you want to jump straight into the configuration, I created a boilerplate containing all required manifests on GitHub.
Architecture Overview
Metrics are collected through user-defined ServiceMonitors or PodMonitors from every namespace by a Cluster Scope Prometheus instance. Tenants query metrics through a central, multi-tenancy enabled query endpoint built with kube-rbac-proxy (to validate the requester) & prom-label-proxy (to enforce a namespace query parameter).
flowchart LR
    A[Tenant] -->|1| grafana(Grafana)
    subgraph Tenant Namespace
    sm([ServiceMonitor]) --> svc(Service)
    qsa([Query Service Account]) <-.-> grafana
    end
    prom -.-> sm
    subgraph Monitoring Namespace
    subgraph Query Frontend
    grafana -->|2| krp(kube-rbac-proxy)
    krp -->|6| plp(prom-label-proxy)
    end
    plp -->|7| prom
    prom(Prometheus)
    end
    subgraph Kubernetes
    krp -->|3| sar{{SubjectAccessReview}}
    sar <-->|4| qsa
    sar -->|5| krp
    end
Setup
Prometheus
I like using the Prometheus Operator to bootstrap instances, although this setup will work with pretty much any Prometheus, which this post assumes is already set up. Should this not be the case, you can find docs & working examples in the posts accompanying GitHub Repo.
Querier Frontend
The querier frontend can be deployed as a single Pod and scaled to any amount of replicas, the only external dependency being SubjectAccessReviews to delegate authorization decisions to the Kubernetes API server. This enables us to treat access to Prometheus Metrics like we would any other Kubernetes resource, only allowing Users or ServiceAccounts with the correct permissions to query.
As Prometheus itself isn’t multi-tenant, we have to find a way to isolate tenants and their metrics. The obvious choice here are namespaces as they most likely already separate your tenants. Operated Prometheus also automatically injects a namespace label into all scraped metrics, so there most likely isn’t much additional work to be done here*.
The simplified flowchart below, shows the full request chain. Requests to the querier frontend will always have to carry a valid Bearer token and a namespace query parameter. The first container in the querier frontend, a kube-rbac-proxy, checks if the request originator has permissions on the pods/metrics subresource in the namespace, defined in the query param of the same name. Should the SubjectAccessReview succeed, the request is passed to the second container, a prom-label-proxy. The label proxy can already assume that the request is valid, so its only task is ensuring separation by injecting the namespace from the query param as a PromQL query parameter. In simpler words, this will forcibly turn queries like go_goroutines{app="demo"} into go_goroutines{app="demo", namespace="<value-from-query-param>"}.
flowchart LR
    subgraph Tenant Namespace
        qsa([Query Service Account]) <-.-> grafana(Grafana)
    end

    subgraph Kubernetes
        sar{{SubjectAccessReview}}
    end

    tnt[Tenant] -->|1 - Query Metrics| grafana
    grafana -->|2 - SA JWT & namespace=tenant| krp(kube-rbac-proxy)

    subgraph Monitoring Namespace
        subgraph Thanos Query Frontend
            krp(kube-rbac-proxy)
            krp -->|3 - Validate SA Perms| sar
            sar -->|4 - Confirm Access| krp
            krp -->|5 - Pass Request| plp(prom-label-proxy)
        end

        plp -->|7 Enforce 'namespace' label| prom

        prom(Prometheus)
    end
Config
The complete config for the querier frontend can be found here, as well as some additional information & manifests. The interesting sections are outlined below.
The entire logic for the kube-rbac-proxy is defined in just nine lines. It retrieves the namespace url parameter & uses it to construct a SubjectAccessReview for the given namespace to make sure the requester has rights to the pods/metrics subresource. The verb will correspond the http method used for the request.
apiVersion: v1
kind: ConfigMap
metadata:
  name: kube-rbac-proxy
data:
  config.yaml: |+
    authorization:
      # setup our template by extracting the value of the namespace url param
      rewrites:
      byQueryParameter:
        name: "namespace"
      # define a template for the SubjectAccessReview
      resourceAttributes:
      apiVersion: v1
      resource: pods
      subresource: metrics # pods/metrics subresource
      namespace: "{{ .Value }}" # value from rewrite above
Service Account
To create SubjectAccessReviews, the kube-rbac-proxy requires elevated rights. Fortunately Kubernetes provides a ClusterRole system:auth-delegator for this exact use case.
apiVersion: v1
kind: ServiceAccount
metadata:
  name: prometheus-kube-rbac-proxy
---
apiVersion: rbac.authorization.k8s.io/v1
kind: ClusterRoleBinding
metadata:
  name: prometheus-kube-rbac-proxy
roleRef:
  apiGroup: rbac.authorization.k8s.io
  kind: ClusterRole
  name: system:auth-delegator
subjects:
  - kind: ServiceAccount
    name: prometheus-kube-rbac-proxy
    # assuming this is being deployed in the monitoring NS
    namespace: monitoring
Deployment
The deployment is kept pretty simple, as we only need to pass a few arguments to the containers. Covering the config, kube-rbac-proxy will listen (securely) on port 9090, forwarding incoming requests to localhost:8080 (the prom-label-proxy). We also need to mount the config created in the configmap above as a file. prom-label-proxy only needs four options, the listen address, the label to enforce, a flag to enable the label APIs, and the upstream (which can be a single Prometheus, a Thanos Sidecar, or a Thanos Querier.)
kind: Deployment
# [...]
      # use the service account from above w/ the `system:auth-delegator` role
      serviceAccountName: prometheus-kube-rbac-proxy
      containers:
      - name: kube-rbac-proxy
        image: quay.io/brancz/kube-rbac-proxy:v0.18.1
        args:
	      # use the secure listen address to make future cert expansion easier
          - "--secure-listen-address=0.0.0.0:9090"
          # set the upstream to the prom-label-proxy
          - "--upstream=http://127.0.0.1:8080/"
          # load the config from a configmap
          - "--config-file=/etc/kube-rbac-proxy/config.yaml"
      - name: prom-label-proxy
        image: quay.io/prometheuscommunity/prom-label-proxy:v0.11.0
        args:
	      # make sure this matches the upstream from above
          - "--insecure-listen-address=127.0.0.1:8080"
		  # can be prometheus, the thanos sidecar, or the thanos storage gateway
          - "--upstream=http://<prometheus>:9090/"
          # set which label/url param should be injected
          - "--label=namespace"
          # enable to make sure label exploration still works
          - "--enable-label-apis=true"
# [...]
Usage
Testing
Once both Prometheus and the query frontend are set up and running & you’ve ingested a few metrics we can start testing the setup. The easiest way to do this is with a quick Grafana instance.
First we’ll need to do a little setup in the tenant namespace (which we’ll call “showcase” from this point onwards). Create a ServiceAccount & Role which matches the rights in the kube-rbac-proxy config.
apiVersion: rbac.authorization.k8s.io/v1
kind: Role # Could also be a ClusterRole
metadata:
  name: namespace-metrics-viewer
rules:
- apiGroups: [""]
  resources:
  - pods/metrics
  verbs: ["get"]
---
apiVersion: v1
kind: ServiceAccount
metadata:
  name: grafana-ds-sa
---
apiVersion: rbac.authorization.k8s.io/v1
kind: RoleBinding
metadata:
  name: grafana-sa-metrics-viewer
roleRef:
  apiGroup: rbac.authorization.k8s.io
  kind: Role
  name: namespace-metrics-viewer
subjects:
- kind: ServiceAccount
  name: grafana-ds-sa
  namespace: showcase
To confirm this ServiceAccount has the correct permissions, you can run kubectl auth can-i get pod --subresource=metrics --as=system:serviceaccount:showcase:grafana-ds-sa
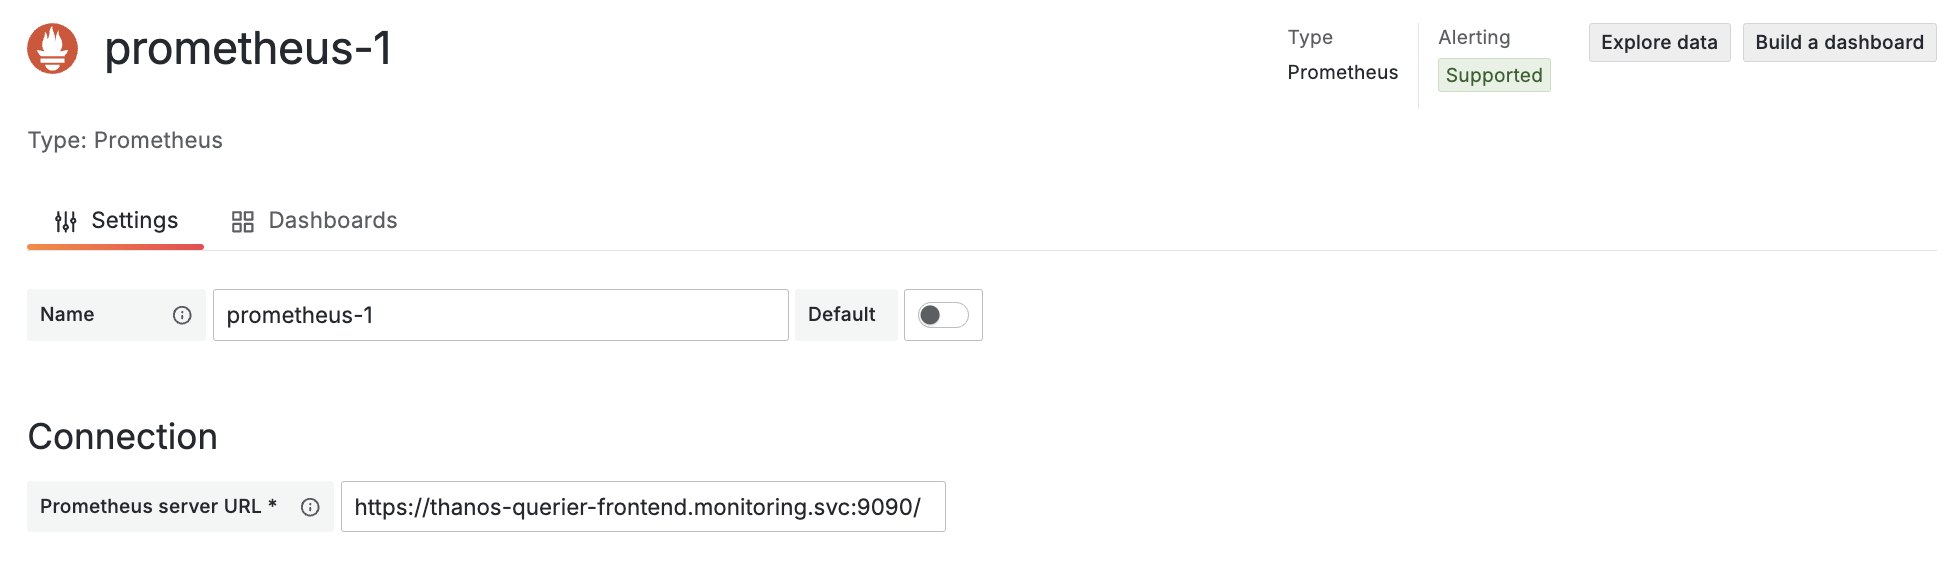
In Grafana, create a new Prometheus Datasource & point it to your querier frontends service, making sure to use https.
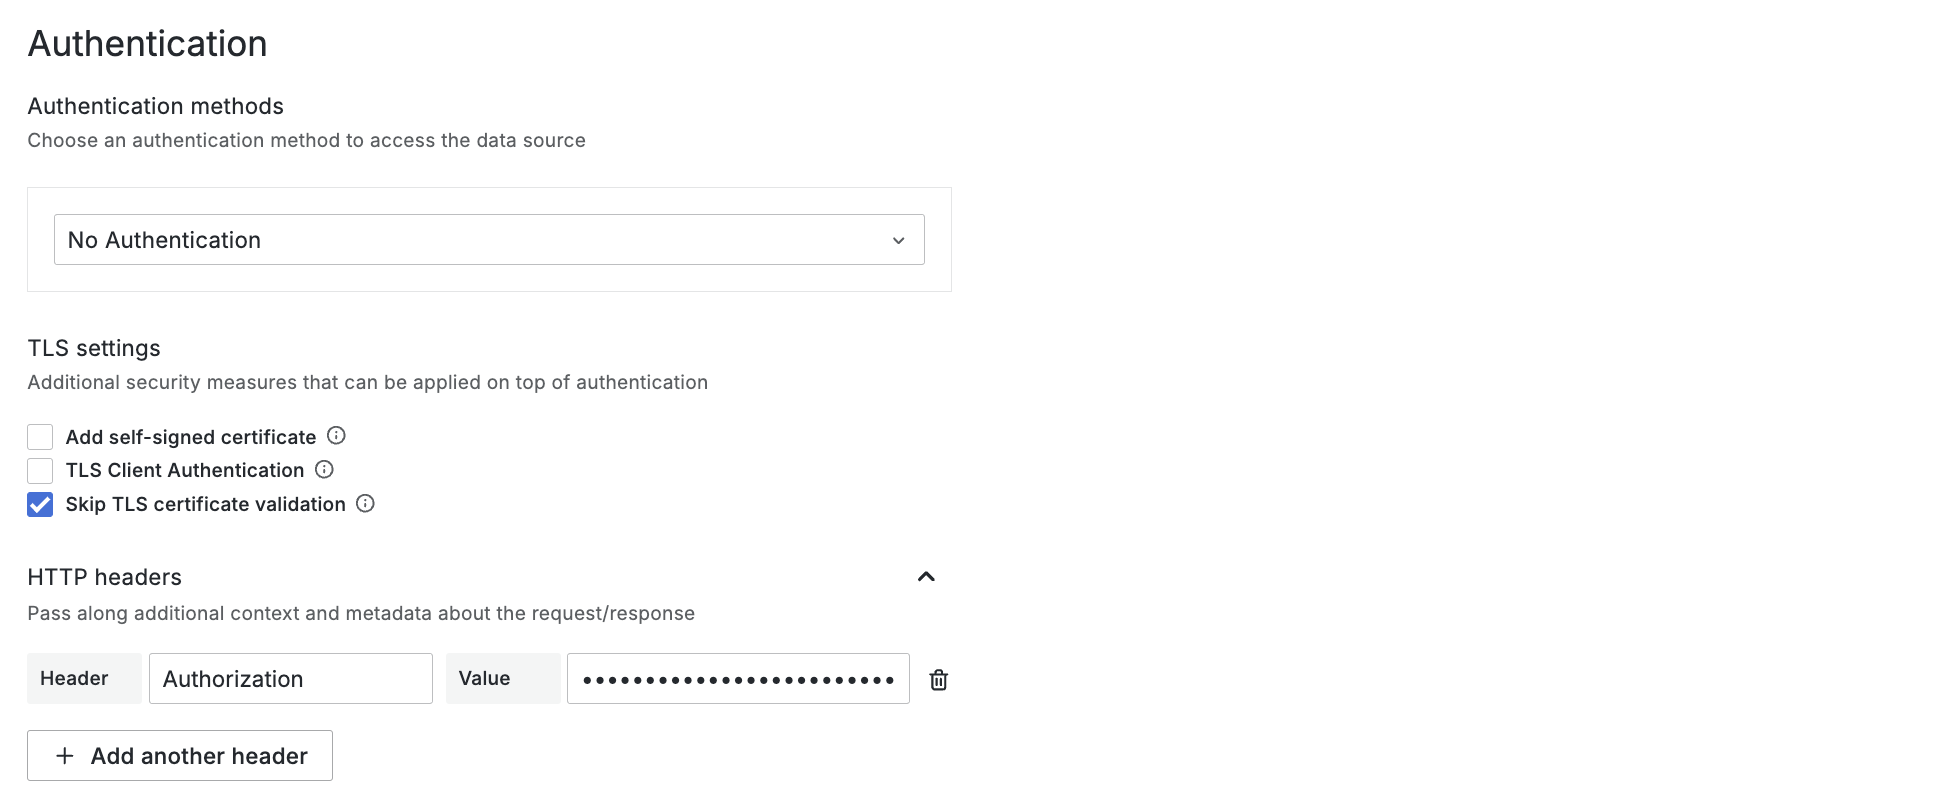
Under Authentication > TLS Settings, turn on “Skip TLS certificate validation” & create a new header Authorization containing Bearer ${token}, ${token} being the previously created service accounts JWT. You can retrieve it by running kubectl create token grafana-ds-sa
Under Advanced settings > Other add the custom query parameter namespace=showcase & set the HTTP method to GET*.
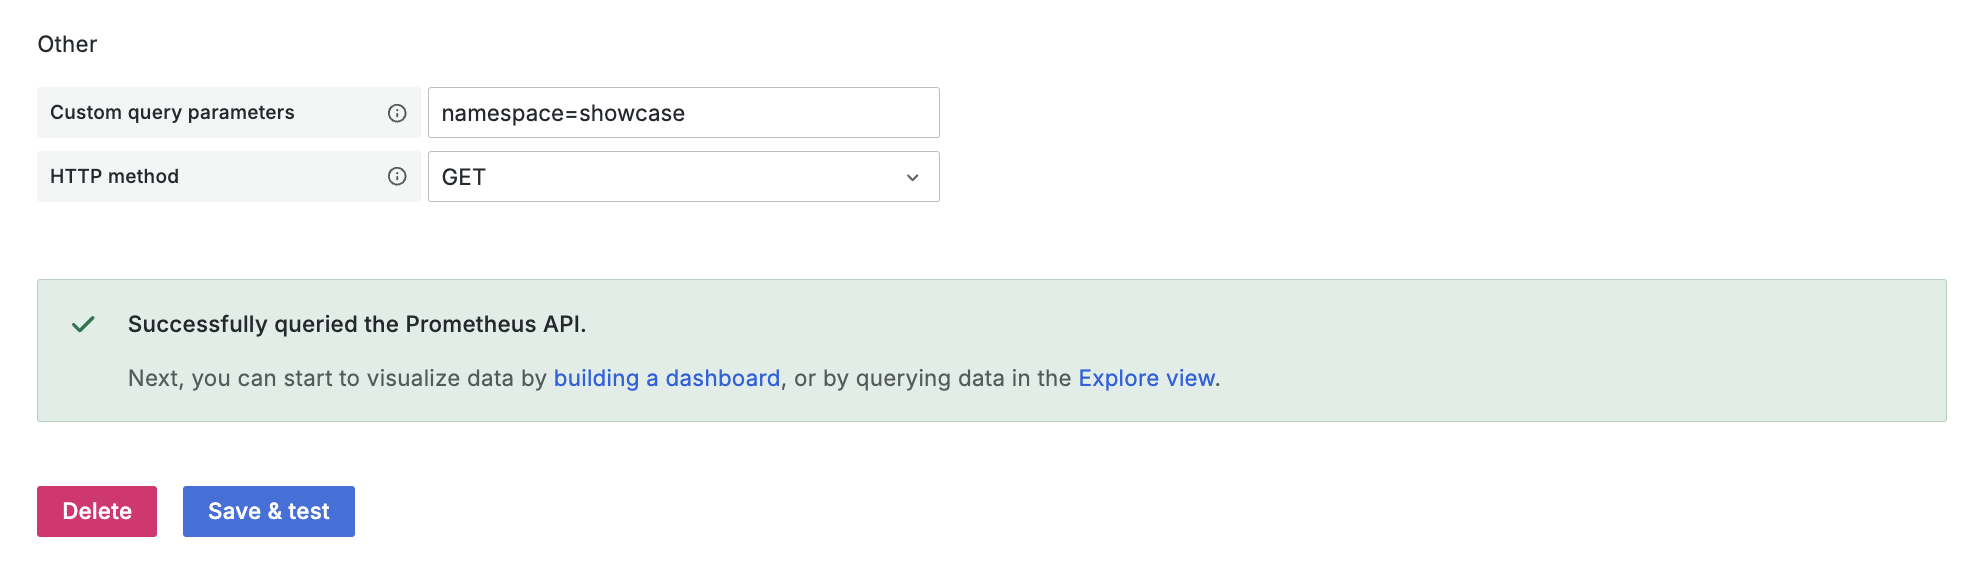
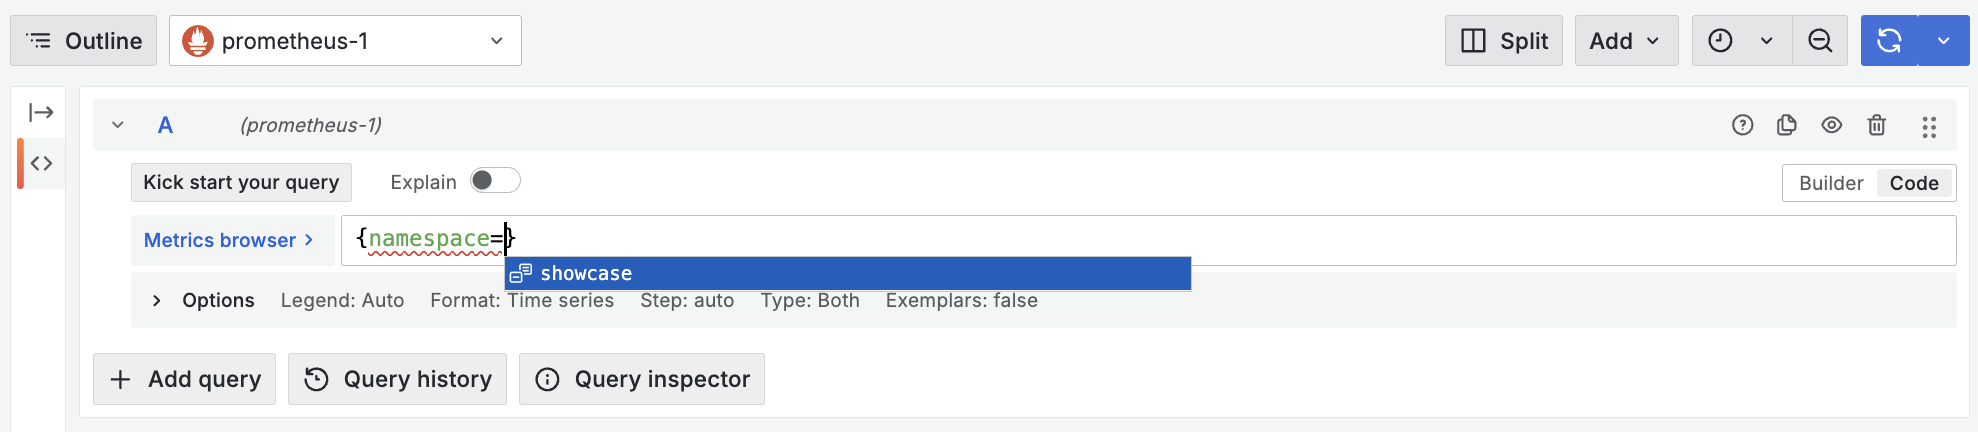
Finally after constructing the request in a way which fulfils all requirements defined earlier for the querier frontend, we can test the datasource. You’ll notice any changes to this config will result in the request being rejected with a 401, try using a different ServiceAccounts token or changing the value of the namespace query parameter. In the “Explore” view, you should be able to query metrics and confirm the isolation by checking which values are available for the “namespace” label.
Production
For production (& to improve your tenants DevEx) we’ll automate all of these steps. The Grafana Operator will make this considerably easier, with each tenant managing their own instance. I usually provide all of this as a simple helm chart, which sets up all required manifests in tenant namespaces.
To get started, bootstrap a Grafana Instance using the Operator & create the ServiceAccount/Bindings from earlier. Additionally, we’ll create a secret to house the ServiceAccounts token & a GrafanaDatasource CRD to automatically provision the Prometheus DS.
Secret
apiVersion: v1
kind: Secret
metadata:
  name: grafana-ds-sa-token
  annotations:
    # references the ServiceAccount, kubernetes will automatically
    # populate this secret for us
    kubernetes.io/service-account.name: grafana-ds-sa
type: kubernetes.io/service-account-token
Grafana Datasource
apiVersion: grafana.integreatly.org/v1beta1
kind: GrafanaDatasource
metadata:
  name: metrics
spec:
  # make sure this matches your Grafana CRD
  instanceSelector:
    matchLabels:
      app: grafana
  # import the token from the secret
  valuesFrom:
    - targetPath: secureJsonData.httpHeaderValue1
      valueFrom:
        secretKeyRef:
          key: token
          name: grafana-ds-sa-token
  # set up datasource, this spec the same one Grafana itself uses to manage datasources,
  # so you can also extract it from the network requests when creating/editing one in the UI
  datasource:
    name: metrics
    type: prometheus
    uid: prometheus1
    access: proxy
    # make sure this matches your services name & namespace
    url: "https://thanos-querier-frontend.monitoring.svc:9090/"
    isDefault: true
    editable: false
    jsonData:
      # specify the tenant namespace name here
      customQueryParameters: "namespace=showcase"
      # set the auth header, value is populated below
      httpHeaderName1: Authorization
      # Important, as kube-rbac-proxy will assume `create` as the default verb on POST requests
      httpMethod: GET
      # disable once proper serving certificates for the querier frontend have been set up
      tlsSkipVerify: true
    secureJsonData:
      # template in the Bearer token value from the secret reference above
      httpHeaderValue1: "Bearer ${token}"
After a few seconds this datasource should show up in the Grafana Instance. Assuming you’ve set up kubelet monitoring, tenants should already be able to gain some insight into how many resources their namespace & pods are using, without having created a single ServiceMonitor themselves.
Wrapping up
With this setup, tenants are now empowered to create simple ServiceMonitors and PodMonitors to scrape their application metrics or exporters in their namespace. They get isolated access to Prometheus while cluster admins are able to query every tenant at once. The querier frontend can be scaled to any required amount of replicas to guarantee query performance to avoid any slowdown introduced through the extra steps.
Other Notes
Thank you for reading! 🔥 Happy (multi-tenancy enabled) monitoring! :)
I’ve appended some thoughts below which didn’t fit the scope of this post but should still be considered in a production deployment.
Network Access
To make this a little more secure, the querier frontend could be deployed in a different namespace to isolate it further from the Prometheus & Thanos deployments. In either case, NetworkPolicies should be used to ensure Prometheus can only be queried through the frontend, not directly.
Prometheus Relabeling Concerns
As outlined in the prom-label-proxy documentation it can’t solve write isolation. To prevent tenants from writing metrics into another tenant’s space by relabeling, some kind of policy (like this sample Gatekeeper Constraint) should be enforced.
Multiple Tenant Namespaces
Should your tenant have multiple namespaces, this same setup can still be used. Tenants can maintain a single Grafana Instance & simply give their Datasource ServiceAccount the required permissions in any additional namespaces. The only unfortunate downside is that a new Datasource needs to be created for every single namespace as the query parameter can’t be a list or dynamic.
Serving Certificates
The kube-rbac-proxy doesn’t have any serving certs defined but still uses the secure listen address. This means clients will have to skip TLS certificate validation until a certificate is added to the deployment (which can be done with --tls-cert-file and other parameters found in the kube-rbac-proxy documentation.)
Query Method Restrictions
kube-rbac-proxy will assume create as the default verb on POST requests, because of https://github.com/brancz/kube-rbac-proxy/blob/master/pkg/proxy/proxy.go#L48-L60. This means Grafana will only be able to GET Prometheus endpoints (unless you adjust your Role.) The only downside to this is smaller requests, which is confirmed the Info button in Grafana.
![]()